

The results of the latest poll are in and the most requested topic is Priceline. There are many reasons why Priceline warrants a discussion. Even though it is well below its all time high of about USD$1379, it is still one of the faster growing stocks of the past 5 years. Priceline was the first S&P 500 stock to trade over one thousand dollars per share. With the next earnings report due shortly there is much to talk about.
Priceline has had a tremendous bullish run up until that last quarterly earnings report. Since then it has struggled to regain its prior momentum. Although many other stocks in the same momentum category have struggled as of late. It is less likely that the problem is specific to Priceline.
The use of online services to book travel related services has become as natural and easy as purchasing music online. The wide adoption of mobile apps that can help you plan a vacation while on the go has shown how far the industry has come. Consumers are in the mindset of getting the maximum value for their discretionary spending. This has helped the online travel industry since the majority of consumers feel that they can get the best deal for travel online.
First we will examine the fundamental case for trading Priceline.
Priceline has a very successful business model. One that has a diversified plan of attack on many levels. Priceline has been able to capitalize by diversifying its revenue sources by regions, technology, brands, and business models.
Priceline simultaneously operates three different business models:
- The Agency model in which transactions are initiated through Priceline.com or one of its websites, but are finally processed and completed with other third party vendors. Priceline acts as an agent and the third party vendor is the ultimate merchant. Priceline makes money through booking or processing fees and from a commission paid to Priceline by the third party vendors. These commissions can be a percentage of the transaction in the low to mid-teens. This model has a low cost of doing business. While it is a lower profit margin model most of the expenses are related to marketing and technology infrastructure. Therefore this model tends to have better returns on invested capital, as the marginal increases in expenses are lower. In other words, it is easier to scale up this type of business because as more customers are purchasing travel services, Priceline does not need to buy any inventory such as hotel rooms or airline tickets to handle increased demand. Priceline only needs to scale up its marketing budgets and technology infrastructure to keep up. Both these expenses are somewhat easy to scale up incrementally and quickly if necessary.
- The Merchant model in which Priceline purchases inventory such as airline tickets and hotel rooms from third party vendors and then sells it on to the consumer. Therefore Priceline acts as the agent and the merchant of the transaction. Priceline typically makes a commission of 20% or more on these types of transactions. Transactions using Priceline’s “Name your own price” service which allows customers to bid on travel services fall under this category. Customer’s bid by telling Priceline how much they are willing to pay without knowing the ultimate service provider. Priceline searches it’s database and inventory and completes the transaction if the price of the service is close to or less than the price bid. Priceline also pockets the difference between the customer bid price and the price the travel service provider is willing to offer. This type of bid and offer transaction is known as the opaque model. While the merchant model produces higher profit margins, it is more difficult to scale. As customer demand increases, Priceline has to deal with increasing marketing and technology expense increases as well as purchasing more inventory to meet consumer demand. The additional purchase can be costly and risky if at some point the increased demand suddenly disappears leaving Priceline holding onto aging inventory.
- The advertising model generates revenues from charging travel service providers for placing advertisements on Priceline’s various web sites. Priceline also generates referral fees when customers end up on a service providers web site by clicking one of the advertisements on one of Priceline’s sites. This includes the category of sites that are called meta-search. These sites allow users to search for prices of airline tickets or hotels from many different providers at once. The meta-search site can now place targeted advertising campaigns within or next to the search results. Meta-search competition comes from the likes of other travel sites such as Expedia or Trip Advisor. However, search engines like Google, Microsoft’s Bing, and Yahoo have joined the fray. Priceline may also be saving money if the profit margin made from Priceline’s advertising outlets is at least comparable than the marginal rate of return it makes from advertising its travel booking services on sites like Google or Facebook.
Priceline has also been successful in diversifying its revenue from a global perspective. Priceline has made an extensive capital investment in expanding in markets outside of the US. Specifically it has focused on Europe, Asia and Latin America. Doing business in these markets has proven successful as many of the non-US markets have lower penetration rates by online travel agencies and are highly fragmented. This means there is less name brand recognition and loyalty for service providers. Therefore the travel service providers need to rely more on an online travel agency (OTA) for acquiring customers. In the arena of hotel rooms, which is the largest source of revenue for Priceline, the Priceline owned Booking.com business has over 400 thousand properties available in over 200 different countries and territories and operates in 42 different languages. Furthermore, travel markets outside of the US are growing at a much faster rate than those in the US. A cursory glance at the gross bookings on Priceline and you can see that the attention paid to non-US markets has paid off.
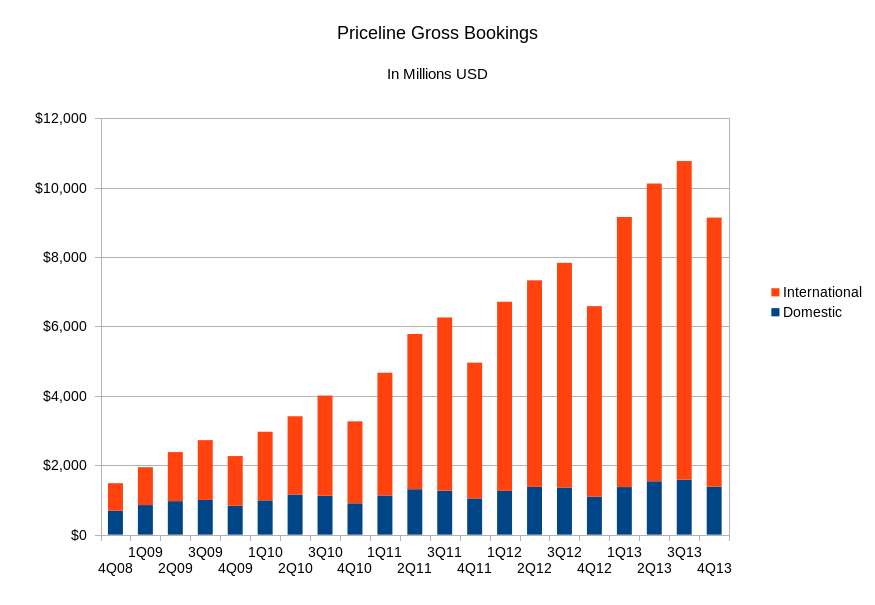 You can see how the blue parts (US Gross Bookings) of the bars have stayed pretty constant while the orange parts (Non-US Gross Bookings) have really taken off. You can really see how Priceline is more of an international company. That being said it is susceptible to a global economic downturn.
Priceline has also diversified its brand by having multiple web presences that cater to different segments of the travel services market. Priceline brands include:
- Priceline.com – a global one stop shopping platform for travel services such as airline travel, lodging, car rental, and cruises. Unique services include opaque model shopping as in name your own price, Express Deals, or Tonight Only. Operates in both merchant and agency models.
- Booking.com – a world leader in accommodations booking. Properties include, hotels, boutique hotels, bed and breakfasts, hostels, and apartment vacation rentals. Operates mostly under an agency model.
- Agoda – a leading hotel reservation company for Asia. Operates mostly under a merchant model.
- Kayak – a meta-search engine designed to direct traffic to other OTAs. Users can search for all types of travel services and compare results among several vendors at once. Revenues are derived from advertisement and referral fees.
- RentalCars.com – a world leader in car rentals.
By having a global reach in user base and product availability, Priceline has benefited from a network effect. The immense catalog of its inventory and number of multiple web site access points makes it very easy for customers to use one of its sites for a one stop vacation shopping experience. It also makes it attractive to travel service vendors who want access to the more than 43 million unique monthly users of its multiple web sites.
Priceline has been so successful at its approach that its competition has begun to copy it. Expedia has spun off its advertising portal Trip Advisor, and has since purchased a 62% stake in Germany’s meta search company Trivago. Travelocity has begun an opaque model called Top Secret Hotels. Expedia has its own opaque model with Hotwire.com. A smaller segment of hotel bookings that is in competition with Priceline, is personal residence rentals. These are the companies that allow people to rent out their homes for travellers. This style of vacation rental has grown as of late, as it is viewed as great way to save money and have a more “authentic” as opposed to “touristy” experience. It is also a great option for those travelling in groups, such as families with children. Websites such as airbnb.com and homeAway.com have been at the forefront of this business model. Priceline is not without competition.
Let us look at how Priceline compares to some of its peers on a fundamental basis.
| Priceline | Expedia | Orbitz | HomeAway | Trip Advisor | |
| Market Cap | 60.92B | 9.21B | 0.783B | 2.97B | 11.57B |
| Forward P/E | 18.25 | 15.77 | 13.81 | 39.73 | 29.59 |
| Profit Margin | 27.9% | 6.5% | 1.5% | 4.5% | 21.8% |
| Return on Assets | 17.9% | 3.6% | 3.8% | 2.1% | 13.4% |
| Return on Equity | 34.5% | 11.6% | 55.7% | 2.2% | 25.8% |
| Revenue | 6.79B | 4.96B | 0.854B | 0.373B | 0.945B |
| 52- Week Change | 74% | 23% | 11% | 10% | 55% |
*Data from Yahoo Finance
Now let us look at the technical side of Priceline.
Priceline has had difficulty regaining its strong performance of the recent past. The last earnings report on February 20, 2014 helped propel Priceline to its all time high of USD$1378.96. However, shortly thereafter Priceline started selling off aggressively until the end of March, when it saw some signs of life. Even with some days of strong buying, Priceline has not been able to break the downward trend. The trend has been so apparent that is has formed into what some chart aficionados like to call a descending triangle. The descending triangle is a continuation pattern in that the trend has inertia behind it and bearish behavior dominates the price action.
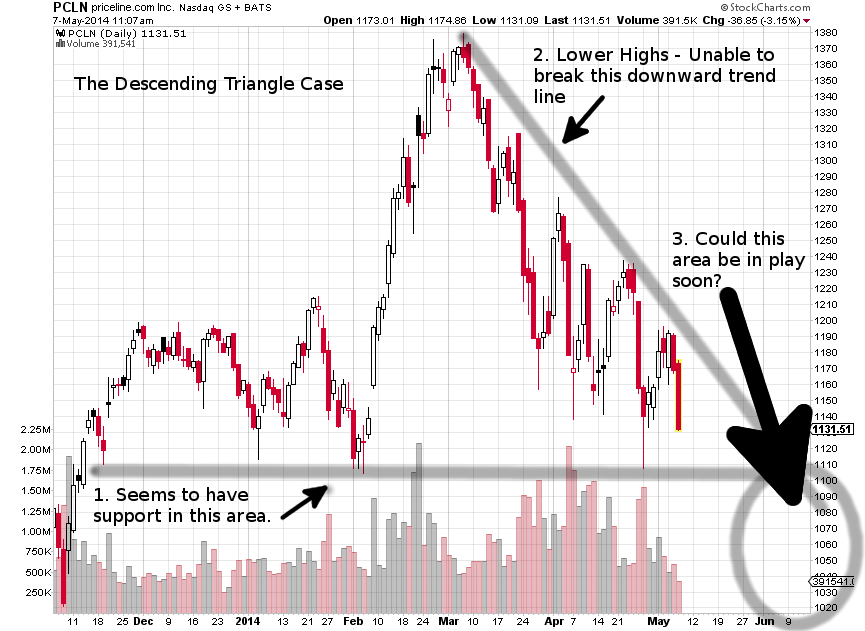 Chart Courtesy of StockCharts.com
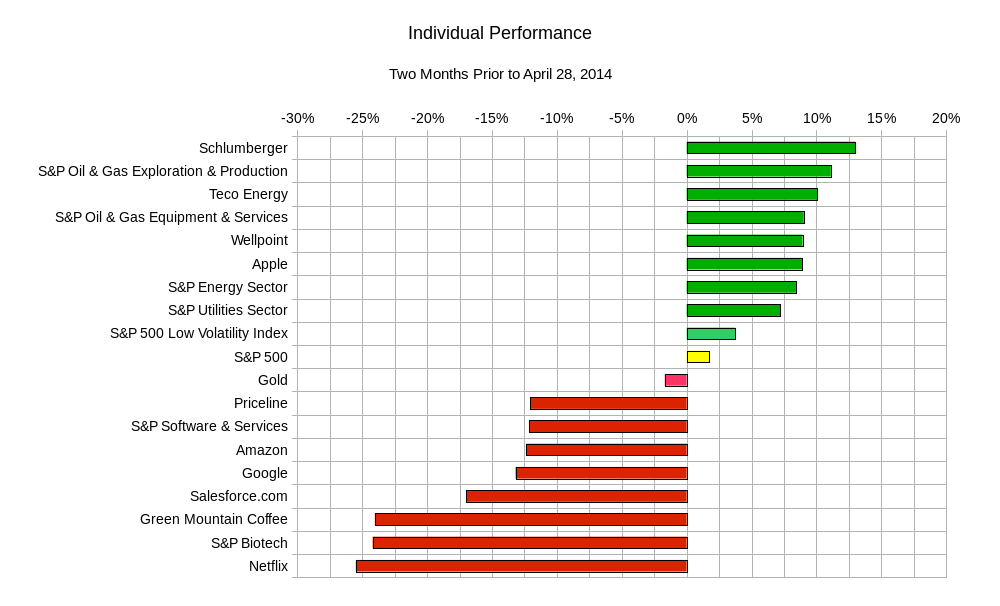
The initial selling in which this pattern started to form was not specific to Priceline. Most other momentum and technology stocks saw aggressive selling in the beginning of March as there was a sector rotation into more conservative stocks. This was mentioned in a market update here at the end of April. The sector rotation is apparent in this chart.
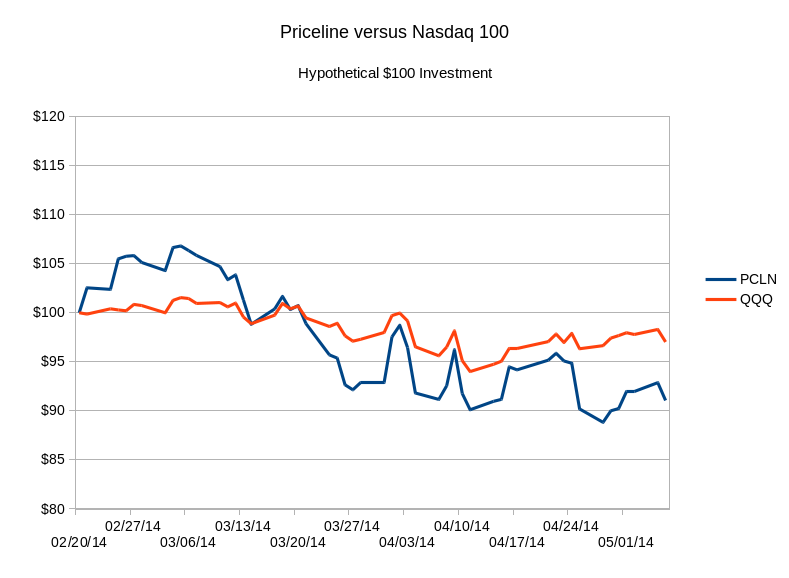
 The thing that is specific to Priceline is that the broader Nasdaq 100 index, as represented by the QQQ ETF, has almost recovered and has outpaced Priceline since the initial decline.
Also weighing Priceline down is the current condition of a longer term moving average of price crossing higher than a short term moving average. Typically this is also indicative of bearish behavior. For a stock that has performed like Priceline this condition has not been seen in a long time.
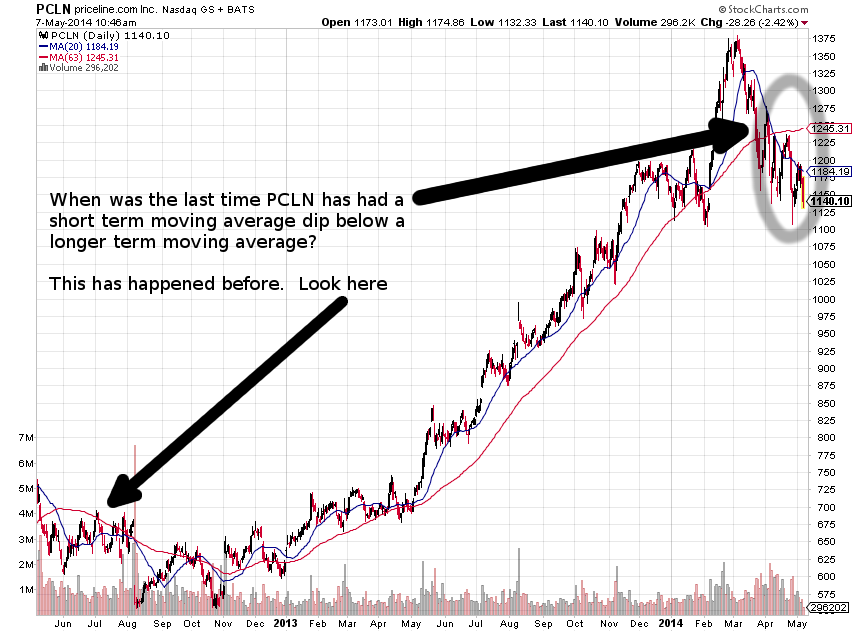 Chart Courtesy of StockCharts.com
The last time Priceline was in this condition it was choppy at best. Looking back at the beginning of the summer of 2012 we see that when Priceline entered this cross of moving averages, it sold off sharply. The selling was swift and over with rather quickly. Then there were opportunities to profit from some rallies. However, the rallies were met with resistance.
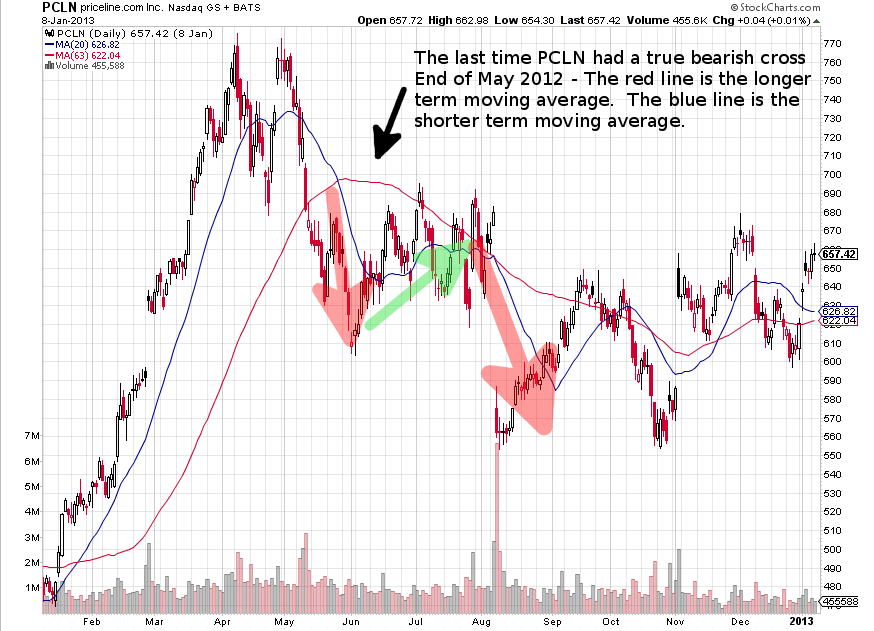 Chart Courtesy of StockCharts.com
You can see how choppy the price action was before ultimately continuing on with its historic uptrend. Though there is no guarantee that history repeats itself. There is at least some precedent as to what might happen this time around.
Looking at the longer term weekly pattern you will notice the beginning of the Head and Shoulders Top pattern. This is a pattern that indicates that a recent upward trend has reached its course and is primed for a reversal. In this case, Priceline would reverse its bullish trend.
 Chart Courtesy of StockCharts.com
Even though there are several bearish technical indications, all is not negative with the Priceline stock. There are several prices that the stock needs to conquer before resuming its buy at any cost performance. Priceline needs to spend some significant time above its short term moving average of around 1184. Then it needs to trade up to and through the 1200 level. At this point it is in danger of forming the dreaded head and shoulders pattern mentioned earlier. Therefore it needs to really steer clear of that by trading up and through the 1270 area to put the recent downward trend in its rear view mirror. Perhaps then it can spend more time in the thirteen hundreds.
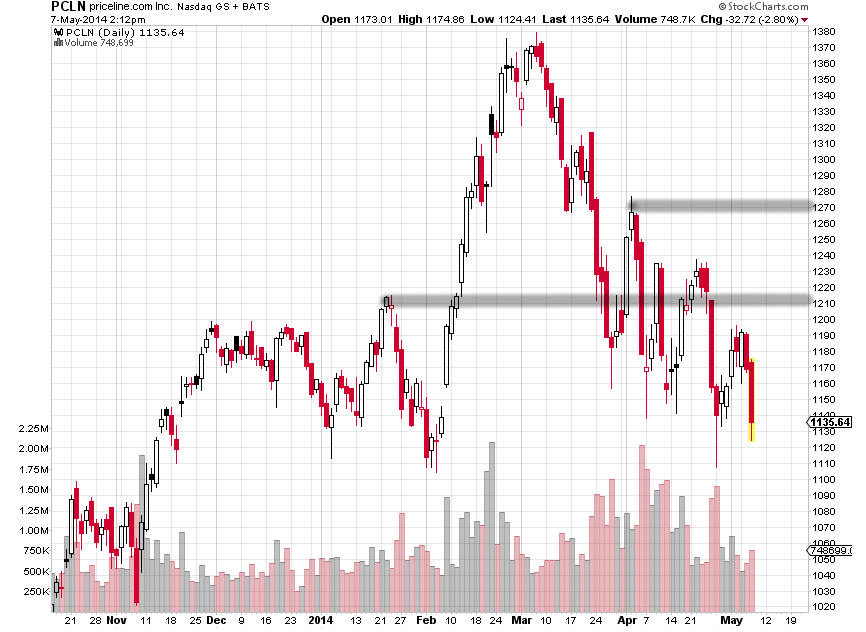 Chart Courtesy of StockCharts.com
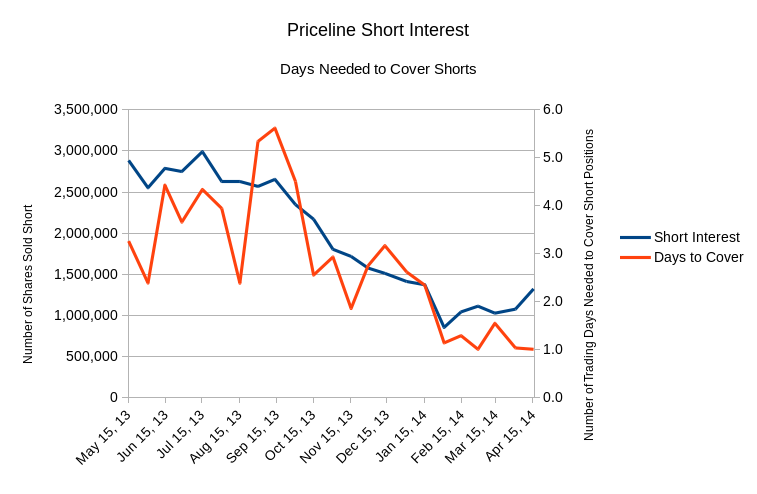
If Priceline recaptures its all time high it will once again punish short sellers. Speaking of short sellers, let us inspect another aspect of the bull run in Priceline; the short squeeze. Many speculators have been shorting Priceline since it has taken off from a little over a year ago. However, since the beginning of 2014 short positions have been reduced. Perhaps this is due to the short sellers being exhausted and realizing that the short positions had little probability of profit. Another telling metric is the number of days to cover the short interest. This metric is defined as the ratio of outstanding short positions to the average daily trading volume in the same period. So if the average short interest is above the average daily volume, then it would require more than one “average volume trading day” to close out all of the short interest. If the days to cover is higher than one it means that traders have given breathing room to their positions. Traders are comfortable with taking on short positions even if there is potentially not enough liquidity to close out all of the positions in a single day. If the days to cover is closer to one, then it means traders have a tight leash on their shorts and are afraid of a dramatic run up in price that would cause the short squeeze phenomenon.
 *Data from Nasdaq.com
Priceline is at an interesting crossroad as evidenced by all of the technical charts described earlier. Adding to the wealth of data presented is the fact that Priceline will be reporting earnings soon for the first quarter of 2014.
Assuming Priceline is at USD$1131.75:
The average move in either direction has been $72.50. As of today the market is pricing in a $57.00 move. The largest move around earnings in recent history has been $99.60 on the upside and $214.70 on the downside. If you look at arithmetic averages of the moves around earnings it would be about $30.75. From the past 14 earnings reports, the stock has closed up for the week 11 times. These statistics can help you put a frame of reference around your trades if you are looking to capitalize on very short term trades around earnings.
However, there is another dynamic to keep in mind. It is noteworthy to look at how Priceline has behaved since breaking the $1000 barrier. Since Priceline has been in the upper atmosphere its price volatility has been somewhat muted. Of the last 14 earnings reports, 5 of them occurred when Priceline was trading above $700. This might temper the move around the earnings.
| 1000’s | 1100’s | 1200’s | 1300’s | |
| Largest Single Day Up | $50 | $57 | $59 | $40 |
| Largest Single Day Down | -$35 | -$60 | -$41 | -$17 |
| Average Daily Move | $5 | -$2 | $4 | $5 |
| Daily Volatility | $18 | $20 | $25 | $18 |
| Days Spent in Range | 35 | 75 | 28 | 16 |
Another interesting artifact about the table above is how bearish the 1100’s are. Priceline has languished in this region for the longest time as compared to the other centiles (75 days versus an average of 39 days). In its time in the 1100’s Priceline actually averages a loss of $2 a day in stark contrast to the $4-$5 gains in the other categories. It is in the bullish trader’s best interest to get Priceline above $1200 or let it fall to $1000 so that the price action can tend to be positive. Therefore traders may continue to stay way if it manages to remain in the $1100 area.
Given the data from the chart above it is more likely that the move in Priceline around this next earnings report will be held in check and closer to the $60 range up or down. If the stock trades higher after earnings then a test of $1200 is likely to follow. After that then Priceline is at a point where the market needs to decide its next course of action. Does it break above the $1210 level and head for the $1270 area to squeeze short sellers? Or does it roll over after breaking $1200 to complete a head and shoulders pattern? If it trades lower after the earnings report then the descending triangle mentioned earlier will likely decide its fate. In this case expect Priceline to trade in the $1000 – $1100 area.
A lot of ground has been covered here. While it is a lot of information to digest, it is an example of the different ways to look at an asset and forming an opinion and expressing it through a trade. Priceline’s stock action is now not as opaque as its Name Your Own Price service they provide. The market will certainly name its own price. Get ready to name yours.
Good luck and trade rationally.