
The results of our online survey are in and the most requested topic was gold. Gold is a very interesting commodity to study. It has a long history. A wide variety of investors and speculators have counted on its large changes in prices and very little utility value. This topic deserves a lot of attention.
A brief history: Gold has played a significant role in shaping the history of mankind. It is a large component of ‘isms such as imperialism, colonialism, and capitalism. Modern day reasons to invest include:
- Inflation
As inflation rises gold has performed very well as people believe it holds it’s value more than paper currency will. A quick example. Imagine you bought an antique treasure map that led to the treasure of a Monte Carlo casino gambler. In 1913, the gambler was playing roulette at Le Grande Casino during the fateful night of the Monte Carlo Fallacy. The gambler bet about a week’s worth of the average US salary on black. The ball landed on black. The gambler let it ride. After successfully repeating the bet 9 times, the gambler walked away with a bunch of Francs. Everyone else remained at the table to become part of history. The gambler exchanged the winnings for dollars and buried the money somewhere in the US. You are ecstatic once you learn of the story. You pay for a bulldozer and the associated fines from the city for digging in the middle of Prospect Park in Brooklyn. You open it and Voila! You just got USD$7,216!!! Now if the gambler at the time took the $7,216 and bought gold (the 1913 average price was $18.92 an ounce), you would find about 381 ounces of gold. Now you can party, because today that is worth about $503,060 USD (assuming a price of $1,319 an ounce). No one makes movies about people looking for buried treasures of dollar bills.
- The US Dollar is losing its status as a reserve currency
The US dollar is the long established currency for safe haven investors. Think about what happens when you hear of an economic crisis outside of the US. The news always mentions the exchange rate. In the recent Euro-zone crisis the Euro performed poorly, especially in the middle of the summer of 2012. So the flight to US Dollars makes sense except that investors might have been worried that the US monetary policy at the time was helping to decrease the value of the dollar. This has pushed some investors to look for alternatives to the US Dollar. This helps fuel the fire for currencies that have a large commodity component, such as the Australian and Canadian Dollars. Bitcoin also gained momentum as a result of the search for a different reserve. There are investors who get nervous about the stability of the US Dollar or any other currency and look to gold.
- Actual consumption
Certain cultures purchase gold for jewellery, adornments, collecting and savings. Many investors look to the Indian wedding season when gifts of gold products are typically given. This has lead to a seasonal supply and demand type of dynamic that some investors look to act upon.
- The apocalyptic scenario and other geopolitical risks
When tensions rise between certain nations or regions, investors usually flock to gold as a safe harbor in case of a government collapse and or prolonged instability. At a cocktail party there is always someone speaking of how they are investing in gold so that when the zombie apocalypse occurs and major governments have vanished you still have something of value. This is an entertaining argument for gold. It is very likely that global instability will lead to spikes in gold prices. However when one makes such large gains one has to look for an exit strategy to capitalize on those gains. If the situation persists and there are societal breakdowns who is going to buy your gold when the commodities you need to survive are food, water, electricity, and gas. When you try to trade in your gold for a few minutes of a hot shower you will most likely be met by warlords with weapons. You would have to think about the optimal time of cashing in on your gains before it is too late. Before the cost of storage, transportation, transacting in gold are prohibitively too high to recoup any of its intrinsic value. A side note, the exchanges will be closed on days of zombie apocalypses so do not expect to unload your position in the GLD ETF on those days.
Back to reality and the current state of affairs.
Looking at recent history it makes sense that gold has a relationship with government monetary policy as the policy affects inflation and currencies. We will explore some relationships with US monetary policy.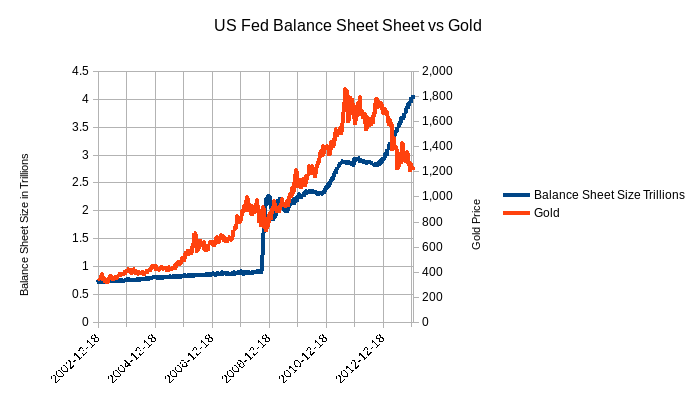
If you look at the chart above you will see there is a strong relationship with the size of the US Federal Reserve Board Balance Sheet and price of gold. That is until the end of 2012. This graph tells us that as the Fed has increased it’s balance sheet by purchasing the US treasury bonds and certain Mortgage-Backed Bonds, gold has taken off. This all coincides with the recent economic crisis that forced the US FOMC into its quantitative easing (bond buying) program. As a result of that program, two of the most widely talked about reasons for owning gold were in focus. Inflation and the fall of the US dollar. Even as those forces remained and the FOMC increased it’s bond buying program (the reason the Fed Balance Sheet increases) gold fell off sharply at the end of 2012. In addition, fears of a Euro collapse were rampant beginning in 2011. There was a European debt crisis and the plausibility of the Euro was a daily topic. So even in light of a perceived imminent financial apocalypse, and the pressures from US Fed policy, gold should be standing at the top of the Olympic podium, instead it ran away.
We see more of the same when we compare the balances on deposit with Federal Reserve Banks versus gold in the chart below. Balances on deposit are monies that the US Government and regulators require banks to have in case something goes really wrong. Think of it as a margin requirement for depository institutions. Two reasons behind the increase of reserve deposits are because of higher probabilities of bad things happening and the idea that banks should have more money to prevent from collapsing. Both are pleasant thoughts. So again why did gold not follow the fear?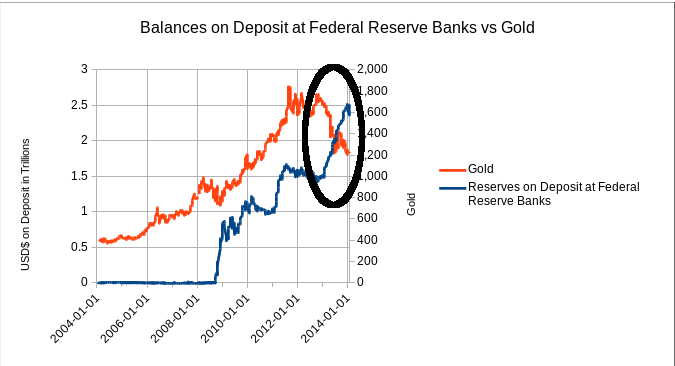
So let us now look at the two forces of inflation and dollar weakness:
First Inflation. You would expect changes in the price of gold to be positively correlated with increases of the measurement of inflation, right? Well let’s take a look: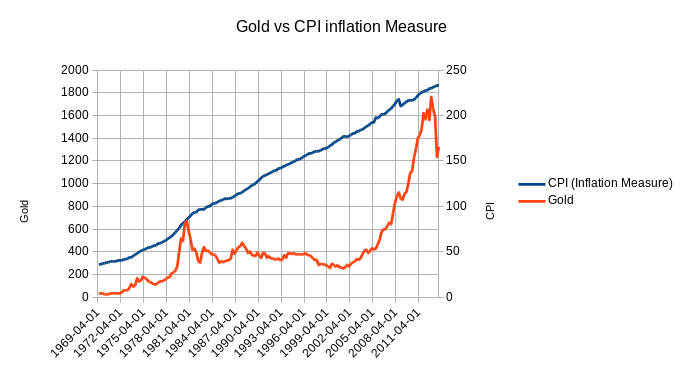 It doesn’t say much, it says that inflation has risen and gold prices have gone up in a very long time frame. Well indeed, as inflation has risen, so has gold if you are looking at it from 1969 to today. The use of gold in pirate movies and the Goonies is now validated. However if your hoping that gold would have helped you from 1981 to 2001, you would have been disappointed. Let’s hope those kids in the Goonies movie cashed in before inflation hit them hard. So perhaps the relationship is not as steady as you suspected? Well then take a look at the actual correlations:
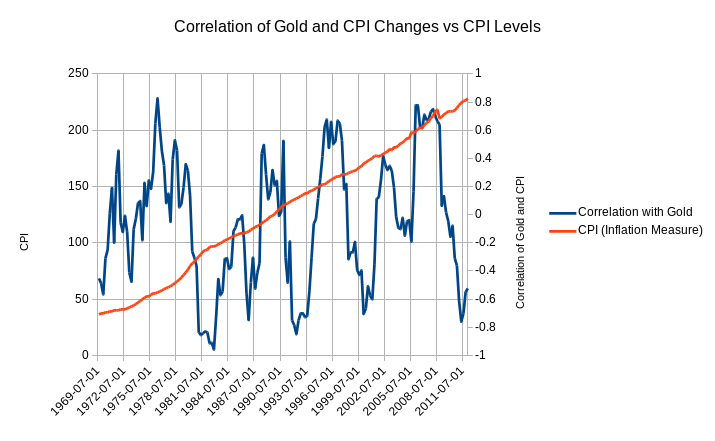 While there is a long term positive correlation of 0.16, It does swing all over the place. The graph shows what the correlation for a two year period between the quarterly changes of gold vs CPI.
The correlation is a number that quantifies the relationship between two series of numbers. A positive correlation means they tend to move in the same direction. A negative one means that they tend to move in the opposite direction. Correlations are always between -1 and 1. The -1 and 1 are extreme values of the relationship. A one means the numbers are identical, a minus one means they are mirror images of each other. A zero means there is no discernible relationship between the two. So 0.16 is something, but it is not like the correlation between hot days and ice cream sales. Correlation also doesn’t mean that the change in one set of numbers causes the change in another. It can be used just to show that there is a relationship that is significant and to some extent how much of one number’s change can be explained by the change in the other.
Apologies for the digression, however correlation is a tool fundamentally built into many technical and quantitative market analyses. The point here is that in your investment or trading time frame it is not clear that you can bet the house on the relationship between changes in inflation and changes in the price of gold.
So what about the relationship between the US Dollar and Gold? For this study we will use the Dollar Index which is a weighted value of several major currencies of the largest trading partners of the US (Euro, UK, Japan, Canada, Australia, etc…)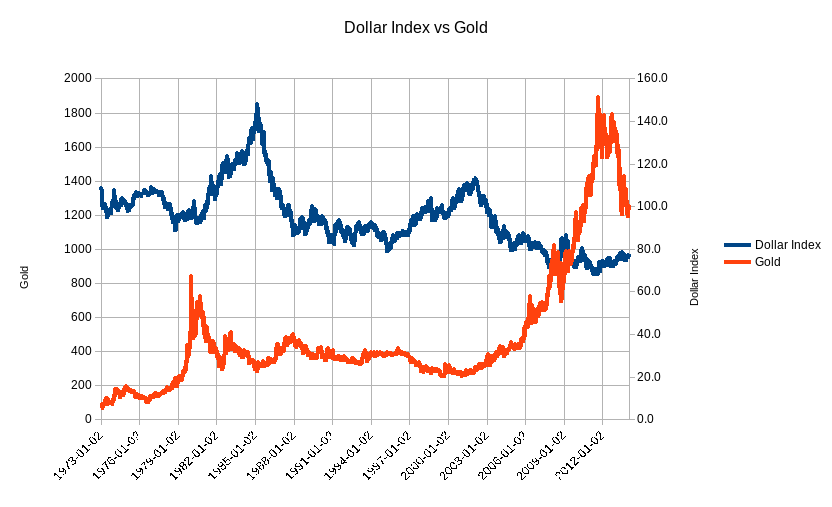 Nothing too remarkable here either. If you are interested in the correlation, the long term correlation is -0.20, the expected negative correlation. When the dollar wakens the price of gold increases and vice versa. However the relationship does not always hold just like in the inflation example. This is relevant because your trade or investment may be during one of these periods when the correlation is moving away from its long term value. Therefore you need to be aware that the behaviour you expect may not hold and may not come to fruition for a while, possibly longer than you can hold onto a losing trade. In the graphic below you can see periods where the correlation is trending upwards towards zero. Where the relationship is non-existent. If you are holding a long position in gold and are looking at a falling dollar for guidance you may not get the performance you hoped for in your gold investment.
 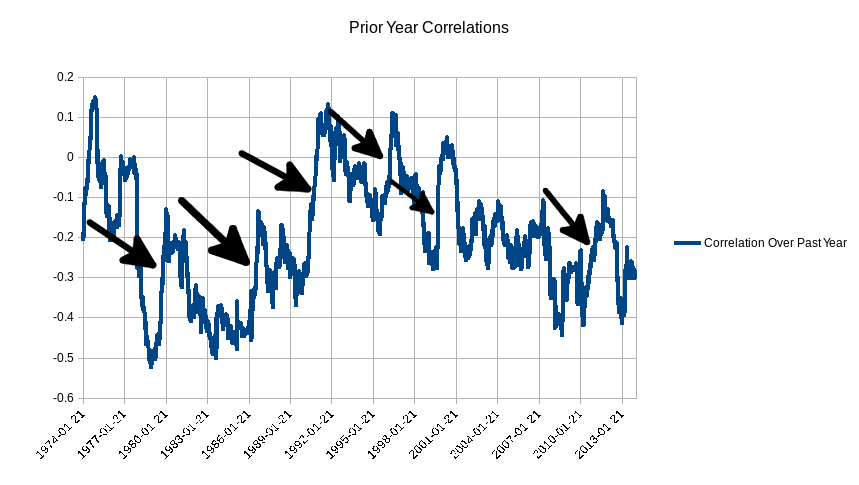 So again, why didn’t gold follow the fear as you might have hoped it would? To study that let us look at a common (though not always accurate) fear index; the VIX. The VIX is the implied volatility of options on the S&P 500. In a nutshell, implied volatility is the premium option traders place on the perceived increase (or decrease) in price swings on the S&P 500. The main idea is that if there is widespread fear, traders will want to purchase put options to protect their long equity positions. The increased demand for these “insurance” puts will drive up the implied volatilities and therefore prices of the options. This will move the VIX upwards. Conversely when things are quiet, the reduced demand for puts will drive the VIX lower. Let us cut to the chase and look at the chart.
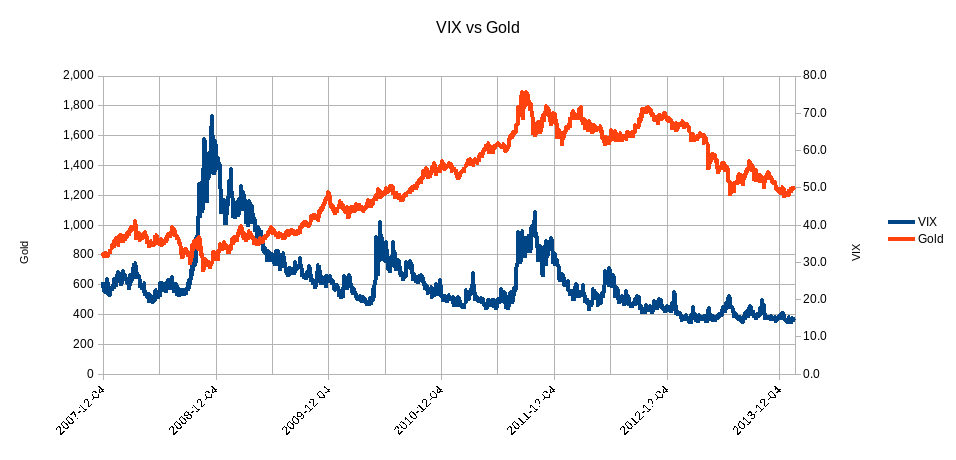 There is nothing remarkable about the relationship between the VIX and gold. In fact the long term correlation in case you were wondering is practically zero. Gold did not follow the fear because it doesn’t normally do so.
Continuing down the path of equities and gold, let us look at the relationship between the S&P 500 and gold.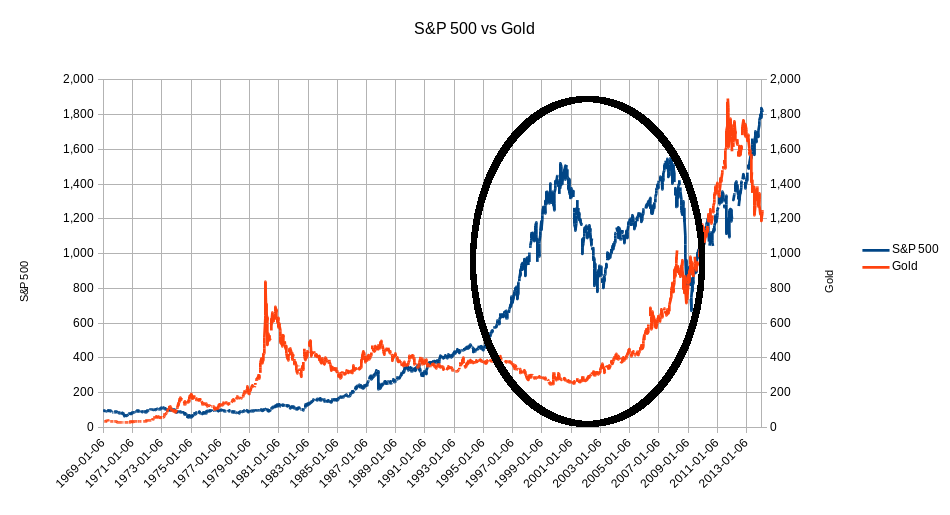 The circled area is of interest because you would have thought the major movements in the S&P 500 would at least be observable in gold. If anything, at the beginning of the recovery of the S&P 500 (from the valley of the twin peaks to the top of the right hand peak), gold took off with the S&P 500. That doesn’t say much about fear of investing in equities being related to the price of gold. For those interested in correlations, the long term correlation is in fact almost zero.
For completeness we will look at US Ten Year Treasury Rates.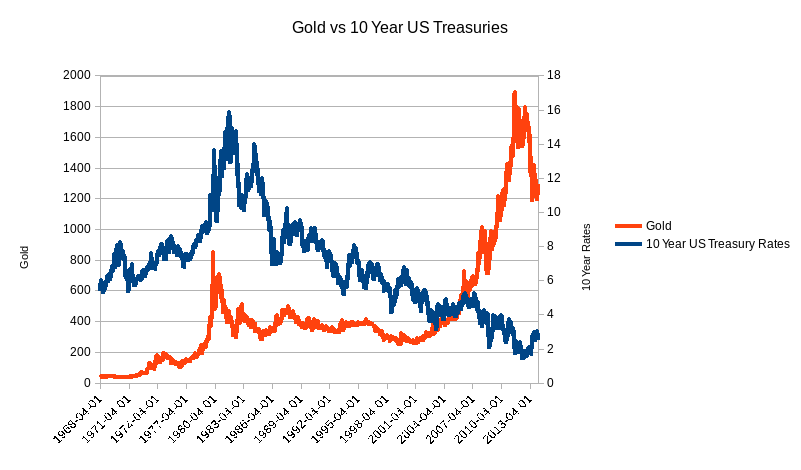 Nothing spectacular here. The long term correlation of daily changes is zero.
Which brings us to look at the current situation in gold. Gold has been struggling since having a disastrous year in 2013. The first month of 2014 saw some volatility and weakness in the equity market and it is possible that investors seeing equities at all time highs decided to shift money to gold which had been beaten down and probably represented a better value in terms of potential upside. Remember the correlation of gold with the S&P 500 is practically nil, so someone looking to diversify might be choosing between equities (at an all time high and dropping) or gold (near recent lows but coming off the lows of last year). When viewed this way, the trade with the higher possibility of profit would be gold. Now both the S&P 500 and gold have been profitable investments. For the near term gold has refused to revisit the lows of 2013 which it had breached twice in 2013 of around $1200 and below. This has appeared to form at least a base in the very short term. A year later, it might be a different story as gold really needs to break its downward momentum where the weekly highs have been successively lower and lower. So the next level to watch is probably going to be around USD$1350. If it breaks through that resistance then there is reason to believe that $1400 is a possibility. It is also possible that $1350 represents a short term high and then there is a precipitous drop. In this case it would be clear that the recent rise did nothing to stop the downward momentum and $1200 might be revisited at some point in the future.
If you are long now, or look to be long, perhaps you should take profits at $1350 unless there are clear signs that $1400 is a target. If you are short or thinking about going short you should ask yourself what are you going to do when gold reaches $1350 and perhaps $1400. A short position should at least be prepared to suffer pain until $1350 and be prepared to make a decision. In other words, have a tight watch on any shorts.
For clarity let us look at a chart.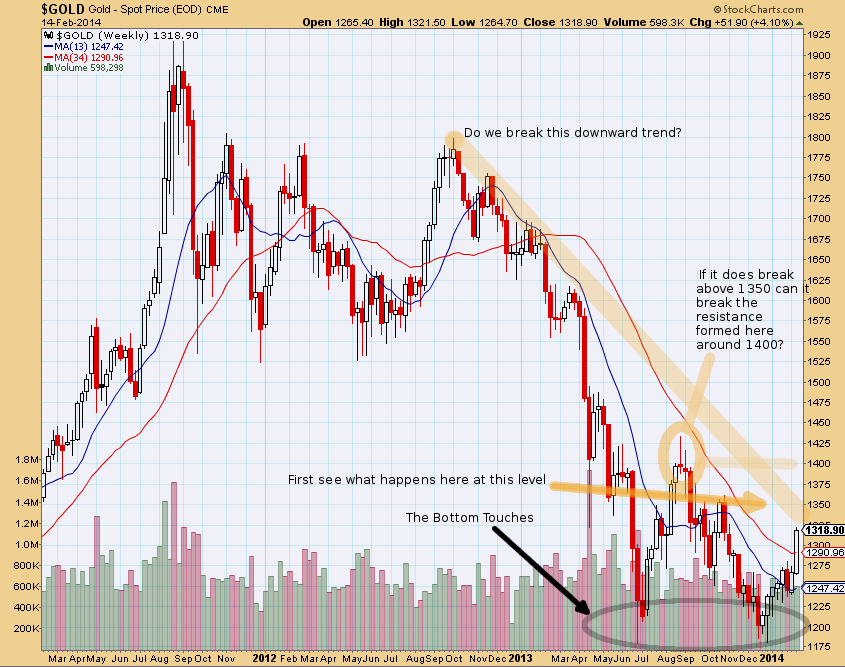 Chart Courtesy of StockCharts.com
So gold is in an exciting place. Very shortly it should be apparent if breaking above $1350 will lead to the $1400 area or if it should start to break down and give up some of its recent gains.
Now if you are a pirate and are looking to bury your gold treasure (please don’t bury stock certificates for the GLD ETF) you may find this graphic interesting.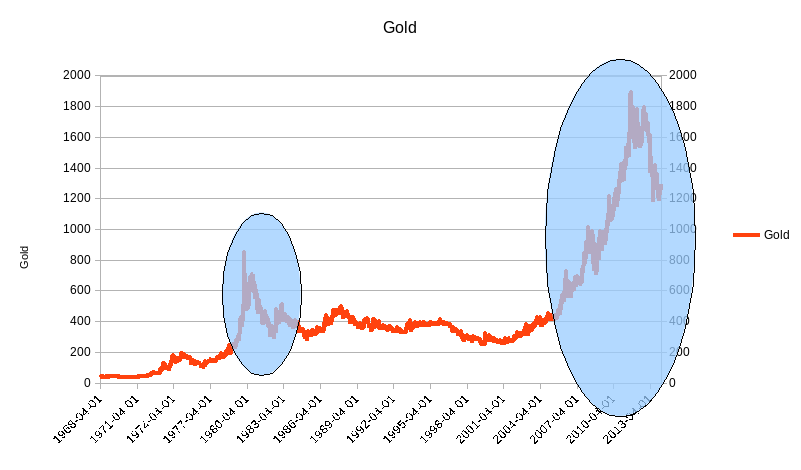 The larger area seems like a repeat of the smaller one. if this is the case, look for 27 years of sideways trading. So enjoy the treasure instead of burying it.
We have covered a lot of ground on gold. In summary, you should be clear about your motivations for trading this asset class. Be careful not to get pulled into the media and gossip hype about how gold is a safe haven asset. We have seen statistically that any such behaviour is pretty much short lived and not reliable. So why do people trade gold? If they are rational they realize it offers diversity versus fixed income and equities, as it has practically zero correlation to either. It is also about 23% more volatile on a daily basis than the S&P 500. Is that the kind of volatility you would expect from a safe haven? Recognize that gold is as speculative as anything else and treat it like you would any other trade.
Good luck and trade rationally.
Sources
- INCOME INEQUALITY IN THE UNITED STATES, 1913-2002* THOMAS PIKETTY, EHESS, Paris
EMMANUEL SAEZ, UC Berkeley and NBER - Prices from 1883-1994, World Gold Council. Taken from Timothy Green’s Historical Gold
- Price Table , London prices converted to U.S.
Dollars. - Prices from 1995-2008, Kitco.com, based on the London PM fix.
- Data from Federal Reserve Economic Data Online Database
- http://www.usinflationcalculator.com/