

Are you ready for the US Employment report this month? By now the excuses of harsh weather are over with.
The market is really looking for a clue on the status of the US employment situation. At this stage of the recovery, this report seems tired, as it has not really provided any insight into the health of the US economy. There are tireless debates that quite frankly are all over the map. There is the opinion that most jobs that are added are low paying jobs and that the true state of the US labor force is that it is “underemployed”. There is also the opinion that the job market is showing robust growth as evidenced in the steady positive numbers seen in the monthly employment report. There is a third argument that this is a jobless recovery and that jobs should not be given the relevance that they had before.
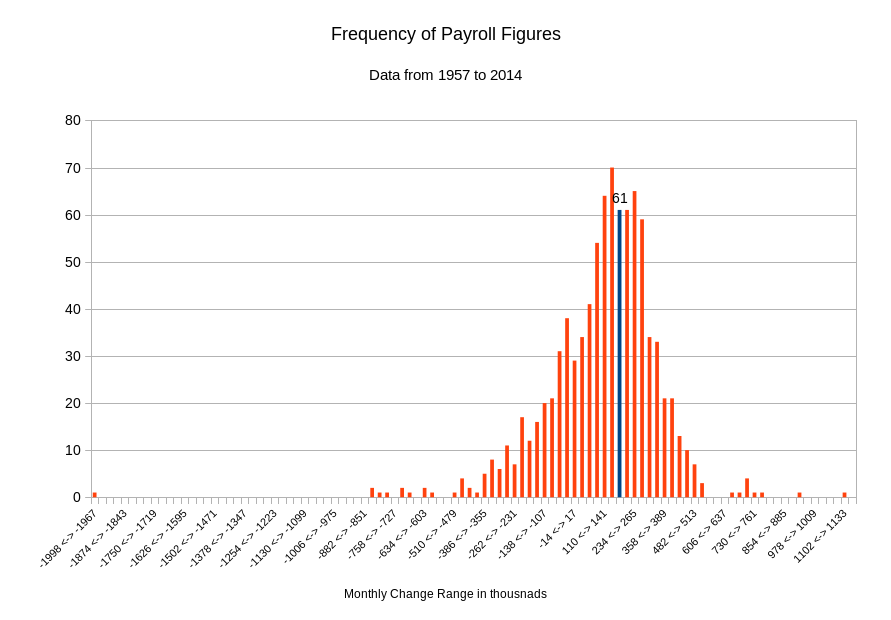
In an odd way all of the arguments are valid. How? In the history of the report the recent data is pretty much average. Since 1939, the average monthly change in US non-farm payrolls is 120,000 new jobs per month. The past year has seen an average of 180,000 new jobs per month. Not too far from the long term average. In fact if we look at a graph of how many times the report fell within a range that is 31,000 jobs wide, you will see that the recent data are right in the middle of the pack historically. The way the chart works is that we count how many times the report fell within two numbers. The numbers are evenly spaced out by about 31,000 jobs. For example, we count how many times the report was between +110,000 and +141,000. In this case, this occurred 64 times out of 901 reports. In another extreme you can see that the report produced between 1,102,000 and 1,133,000 jobs only once. Most of the reports occur in the ranges with the highest bars in the graph. Our current 12 month average is highlighted by the blue bar. The range we are in (172,000 and 203,000) has occurred 61 times out of 901 reports. In other words there is nothing far from ordinary about the reports that have been coming out.
What this market is craving is a report above 300,000 jobs. Something that will bring back the excitement to Employment Friday. What is needed is a report that will shift the debates about employment into a more focused discussion rather than the current ambiguous and non-committal commentary.
While debates about employment are usually academic, what is important is how this report can affect your trading. One chart that may be of interest is one that compares the S&P 500 with the change in Non-Farm Payrolls. Specifically let us examine the average value of the S&P 500 over a month versus the 12 month average of the changes in Non-Farm payrolls.
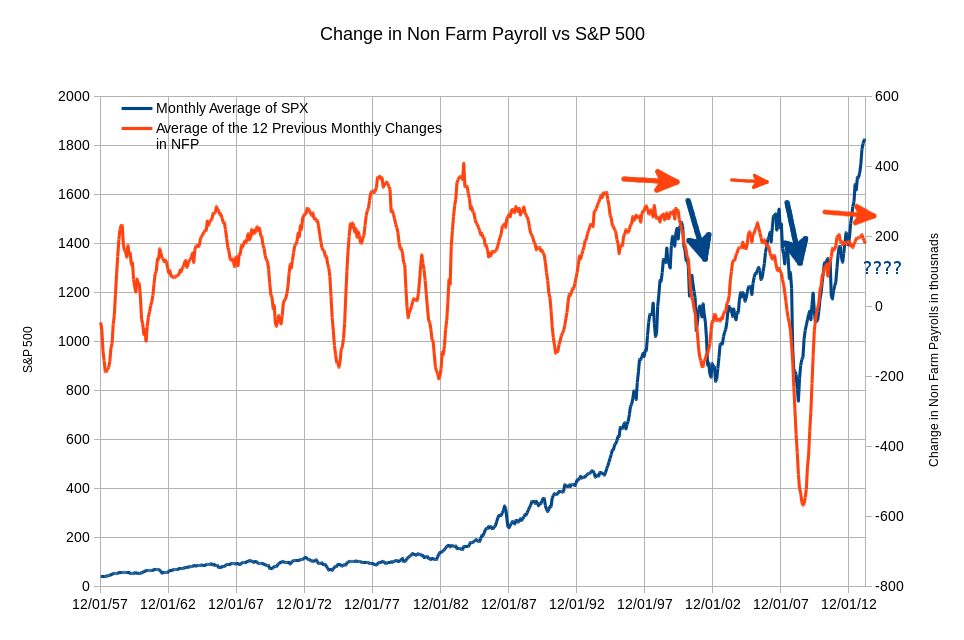
What is apparent is that the 12 month average changes in payrolls really behaves like a wave. It starts to rise, levels off, and then breaks down. What is alarming is that this average has seemed to level off recently. Are we in for a breakdown in employment? Another observation to make is that since the late 1990s, whenever there has been a break in the average change in Non-Farm payrolls, the S&P 500 has followed. Further back in history, this is not the case. In the late 1970s and 1980s payrolls dropped while the S&P 500 continued to grow. Time will tell.
For now, here are the current market reaction statistics on Employment Fridays using today’s levels. Here we are looking at popular ETFs: SPY (S&P 500); GLD (Gold); IEF (7-10 year US Treasuries); USO (Oil). The numbers here represent the range (plus or minus) that may be observed in each of the categories for each of the ETFs.
| Ticker | Spot Price | Open to Close on NFP Day | Day Before Close to Open on NFP Day | Day Before Close to Close on NFP Day | Typical 1 Standard Deviation |
| SPY | $188.97 | $1.39 | $1.90 | $1.43 | $2.29 |
| GLD | $123.85 | $0.82 | $1.63 | $1.26 | $1.62 |
| IEF | $101.05 | $0.24 | $0.35 | $0.26 | $0.45 |
| USO | $35.88 | $0.41 | $0.65 | $0.51 | $0.76 |
Most importantly is to keep your trading in perspective and recognize the forces that may affect your trades. It does not matter if you have invested in the most well run company that has a cure for the common cold. Always be prepared.
Good luck and trade rationally.