A new year is upon us. Where did things end up in 2015? After the weekly summary graphs are the results.
Charts Courtesy of Yahoo Finance.

Investing in a Win-Win Market
A new year is upon us. Where did things end up in 2015? After the weekly summary graphs are the results.
Charts Courtesy of Yahoo Finance.
The Greek referendum brought a “No” and the world has not ended, so what is next?
Charts Courtesy of Yahoo Finance.
The disappointing US labor report last Friday left a lot to ponder over the weekend. With the majority of market players on holiday, how and when will the market digest this data point?
Charts Courtesy of Yahoo Finance.
With the equity markets at all time highs and central bankers poised to keep the flow of “cheap” money going, the questions most people are asking are 1) When is the drop going to happen? or 2) If the drop happens when is it safe to buy? There are no easy answers nor are there any “correct” ones. The only answers are logical ones.
Charts Courtesy of Yahoo Finance.
Now that the year has started to take shape it is time to put money to work or to at least put work into protecting money if staying on the sidelines is the appropriate choice for you.
With the end of January behind us, it is time to look forward to the next few months of trading. One of the consistently looming questions is about volatility in the markets. Remember, historically January is not the most volatile month. However, there is some merit to looking at monthly historical cycles.
As the new year begins to take shape and certain market dynamics are beginning to play out has your trading style adjusted? Despite a seemingly volatile 2015, most equity indices are flat for the year. Your trading performance should be indicative of how you have weathered the storm that has taken broad equity markets everywhere, but ultimately nowhere.
Charts Courtesy of Yahoo Finance
The end of the year is upon us. In terms of trading, the year end should just be a phase the market is passing through. However, you should still set a resolution to be a more effective trader or investor. The scorecard is resetting to zero soon. That means prior results, both good and bad, should not be brought into the new year and either give you inflated confidence or extreme despair. The odds of a winning trade are still the same. Make it a point to stick to trades where the most likely outcome is a positive one.
Charts Courtesy of Yahoo Finance
Turning our attention to oil, West Texas Intermediate (WTI), we can see that the recent rally had actually begun to build before the recent situation in Iraq came to the forefront of oil traders. In the chart below you can see how the downdrafts within the positive tend have a somewhat cyclical pattern. The length or magnitude of the down moves (highlighted with red arrows) tends to get smaller before a large breakout (highlighted with green arrows) occurs. Since just before the start of the new year the red downdrafts began. The downdrafts were smaller and smaller as time goes on and we now appear to be in an upward phase. The recent news out of Iraq is only increasing the liquidity of oil and making it easier for sellers to sell to a wider audience.
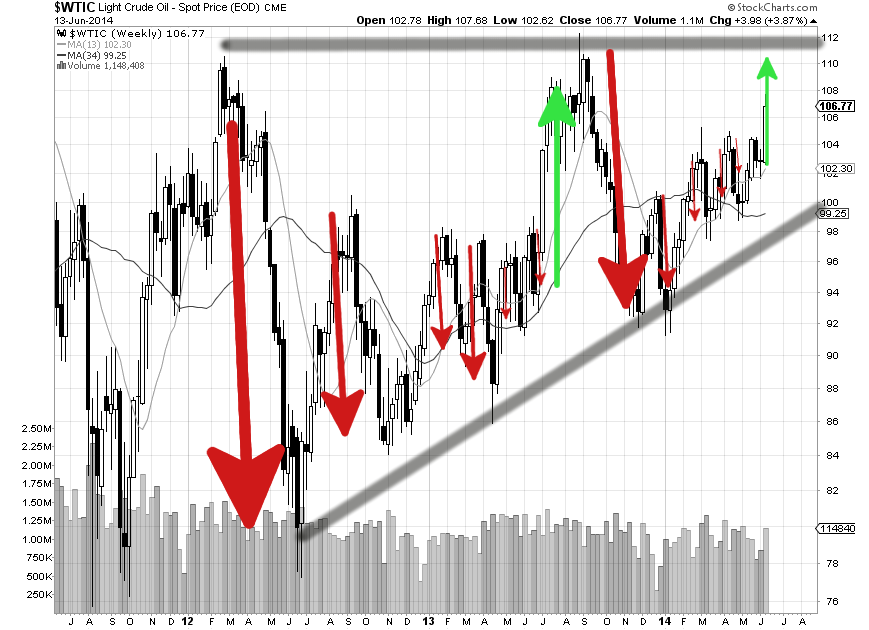
If the last period of sectarian violence in 2006 through 2007 is any indication of the near future of oil prices, speculators may be in for a disappointment. While an upside move to USD$112 and above is reasonable, it would be most likely be short lived if it happened. Just like the rally highlighted by the green arrow at the end of the summer of 2013, the rally can be taken away to start a new cycle. The difference here is that a higher floor for prices has been established. Those who are not committed to being bullish or bearish on oil prices might assume prices to trade between USD$114 and USD$100 in the very near term.
Option writers could be poised to take advantage of the increased liquidity in oil. Although news will focus on “stability” stories, the volatility of oil was 75% of its normal value during 2006 through 2007 as compared to 2004 up to today.
| During 2006-2007 | 2004-Today | |||||
| Equivalent Move (Today’s Prices) | One Day Periods | One Week Periods | Two Week Periods | One Day Periods | One Week Periods | Two Week Periods |
| Maximum | $113.55 | $118.23 | $119.19 | $125.82 | $157.26 | $156.31 |
| Average | $106.77 | $106.76 | $106.76 | $106.84 | $107.13 | $107.46 |
| Minimum | $101.64 | $98.13 | $92.34 | $93.92 | $73.75 | $76.00 |
| Standard Deviation | $1.96 | $4.08 | $5.45 | $2.50 | $5.60 | $7.44 |
Certainly there were other forces at work in the oil market in the above time frames. However, It is important to put market moves in context so that you can set realistic goals for your trading.
Good luck and trade rationally.
The more things change, the more they stay the same. After a week full of economic news, the market ended up almost where it began last week. Will this week break the monotony? Will the popular catchphrase of “sell in May and go away” hold? The media will be using that phrase repeatedly this week.