

Markets up, Markets down. With no clear direction, the only direction is to stay nimble and keep expectations in check.
Last week started off slow as most of Europe was still closed for the Easter Holiday. Then Tuesday the market showed signs of life only to slowly fizzle out beginning on Wednesday. The rest of the week was sluggish despite the boost in the technology sector from the Apple earnings report. Tensions between Russia and Ukraine kept the markets at bay for the rest of the week. The trend of selling on Fridays continued.
Despite the geopolitical concerns with Russia and Ukraine, earnings reports, economic data, and fresh all time highs, the market has traded sideways. The possibility of the sideways trade was first discussed here at the end of February. Since then the SPY ETF, which tracks the S&P 500, has gone up by 1.2%. To put that in context, a one standard deviation one day move, which should be expected 68% of the time, is about 1.2%. In other words the market has moved as much in about 45 trading sessions as it does in a single day.
This type of action can help you gauge your trading style and help to identify strengths and weaknesses. If you are a long term investor and bought or sold SPY back on February 24, you would barely notice a difference in the value of your position. If you had actively traded during this period there were opportunities to make money or lose money.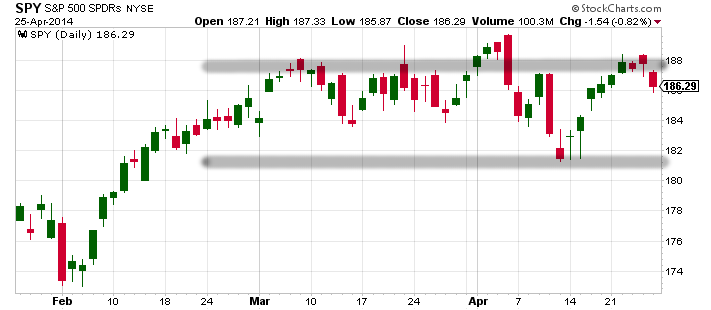 Chart Courtesy of StockCharts.com
One way you could have traded actively would be to try and take advantage of intra-day volatility by entering and exiting trades in time frames of minutes or hours at most. During the past few months intra-day trends tended to occur more often than not. The S&P 500 ETF, SPY, typically closes within 0.35% of its extreme values of the day (high or low). During the past two months it closed within 0.24% of the high or low. This difference may seem small and irrelevant, however to a day trader it means everything. The SPY usually rejects highs and lows and settles on a price somewhere in between. There is a bit of two way, buying and selling action when near the highs or lows. Enough so to create the 0.35% difference between the close of the day and the high for positive days, or the low for negative days. When the market is closing nearer to the highs or lows, 0.24% being smaller than 0.35%, it usually indicates that the direction for the day is decided and it is a one-direction trade. If you did not participate early on then you probably missed the opportunity for trading on intra-day volatility. If you are trading the SPY, then that difference, the differnece between 0.35% and 0.24%, is about $0.20. For the very short term trader who is concerned with hours at most, that difference would represent a nice cushion for any trade; large enough to cover transaction costs.
During this time frame there were three short term directional trends that you might have been able to latch on to if you care to hold onto positions for a few days.
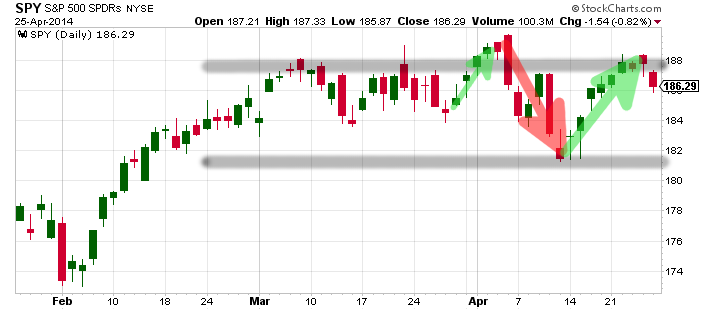 Chart Courtesy of StockCharts.com
Another way to have profited these past two months is by recognizing the sector rotation that has taken place. While the overall market has not moved much, its underpinnings have really gone through a major gyration. If we observe how some popular investments have performed in the past two months you see how investors could have seen a large swing in their profits and losses.
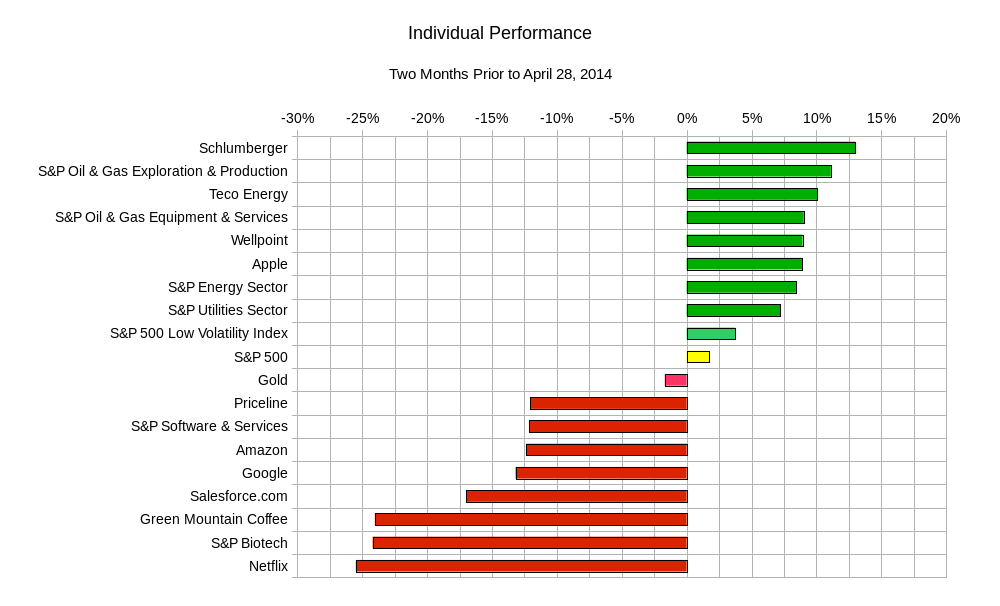 What is evident, is that the names that are routinely mentioned in the media have really been punished, while the more conservative names with traditional valuations have performed well. Despite the lack of movement in the overall S&P 500, you can clearly see how some of the sectors, along with some widely held investments have really moved in a large way.
Also of note, is that this rotation has not shown a lack of confidence in the overall market. You can see from the chart above that the S&P Low Volatility index has performed about twice as well as the overall index. The S&P index did not sell off sharply, and gold barely moved. While none of these observations mean much in a longer time frame, in a much shorter one it appears that the market is in a moment of indecision and not of panic. So rather than take off all risky bets, investors seemed to have parked their capital in less risky investments as oppose to traditional safe haven assets. Therefore giving themselves exposure to the equity market in general, while perhaps skipping the wild ride experience from some of the high performance stocks of recent times. This behaviour is in line with the current economic conditions. The global economy has not collapsed. Indications from the US is that its economy is growing, even if not at a breakneck pace. Central banks are in no rush to shift their policies one way or the other. The only real wild card out there seems to be geopolitical situations. The markets may stay in a predictable holding pattern. If there was a political flare up that resulted in a violent crisis then the more defensive names would not be hurt as much as a speculative biotech or software company would. If the economies are shown to have improved dramatically, then the rising tide of cash into the equity market will help conservative investments even if they do not perform as well as a speculative technology name does. It seems like a prudent enough approach. This week will likely shed light on whether or not that investment tactic is successful.
This week will bring some important economic data along with earnings that may support the current investment sector rotation. Potential turning points will be the US Fed announcement on Wednesday and the monthly US jobs report on Friday.
Monday brings the US Pending Home Sales; Tuesday brings the UK Gross Domestic Product (GDP), German Consumer Price Index (CPI), earnings from Valero Energy, Twitter, and 3-D systems; Wednesday brings the US first quarter GDP Estimate, German Unemployment, Bank of Japan Rate Decision and Statement, Eurozone CPI, US FOMC Rate Decision and Policy Statement, earnings from Royal Dutch Shell, Total, Yelp, Hess, Embraer, Philips 66, and Wisconsin Energy; Thursday brings the US ISM Manufacturing Index, US weekly jobless claims, earnings for ExxonMobil, Mastercard, ConocoPhillips, Expedia, LinkedIn, and Akamai; Friday brings the US Monthly Jobs report and earnings from Chevron.
Overall the SPY should land between USD$182.70 and USD$190.30. Other benchmark ranges include IEF, the 7-10 Year US Treasuries ETF, which can end up between $101.00 and $102.90; USO, the US oil ETF, can end up between $35.60 and $37.90; GLD, the gold ETF, can end up between $122.20 and $128.80
The previous two months can help shed light into what kind of trading activities best suit you. If you are a long term investor, did you notice the sector rotation? If you are a very short term trader, did you get in and then out of the markets capturing the short term trends in an otherwise sideways market? Keep track of your performance and take a critical approach to your trading activities. If a certain time frame proves to be more difficult to achieve profits, then refrain until you have figured out the kinks in your analysis of the market situation. Discipline is the key to long term success.
Good luck and trade rationally.