

Did you spend the summer holiday season successfully trading or successfully relaxing? Now that the summer holiday season has drawn to a close it is time to start considering the rest of the year and make sure your trading strategies are ready to have a strong finish to the year.
Charts Courtesy of Yahoo Finance
It has been an interesting past 3 months in the markets despite the lack of volatility which is typical this time of year. What made this summer interesting is how major indices have performed and almost every bullish trade has been successful. This made it easier for the optimistic trader, but has made it frustrating for those who like to take contrarian views that profit when the markets move against popular expectations and momentum. The good news is that downside price action has been actionable. That is, where temporary breaks in trends have been have been recognizable and have lasted long enough for those who are swift enough to take advantage and profit.
That is why it is important to recognize your strengths and weaknesses trading in financial markets. If you are able to be discipline yourself to take on positions and exit quickly based on rules or parameters you can take advantage of low volatility periods. Mistakes usually are not as costly in this type of period either. As there is usually a slow moving drift that should give ample time to make a proper trading decision.
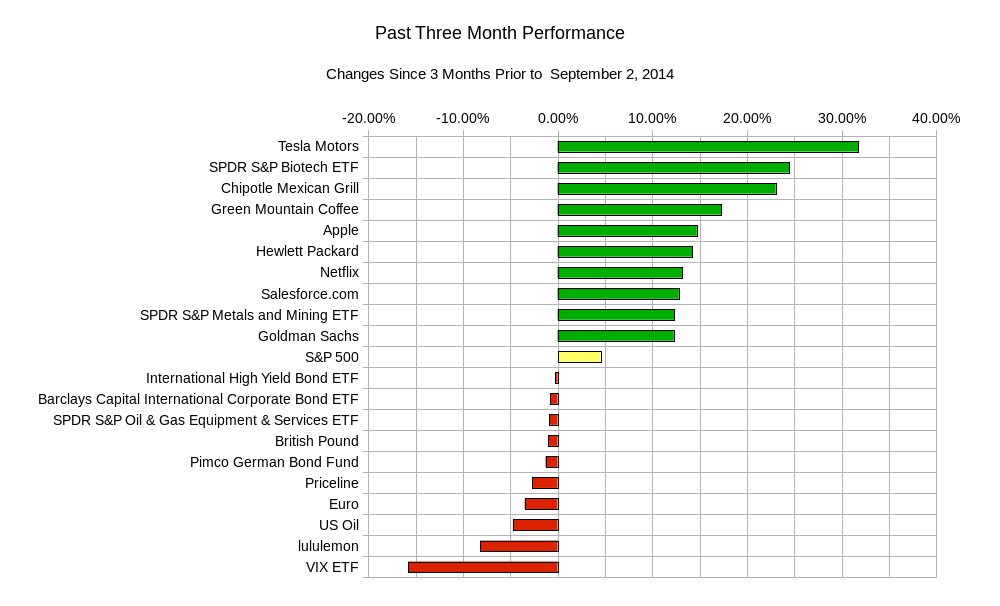
If you are the type of trader that feels distracted by shorter term ebbs and flows you too have probably profited. As there hasn’t been too many investments that have provided negative returns for the past three months. Those that have such as oil, Euro currency, German bonds, and Priceline.com have had their losses capped for the most part at under 5%. Only the VIX and speculator favorite Lululemon have had larger losses. The positive return investments in stark contrast have all gained over 10% during the same period. Here is a chart that summarizes the past three months.
The past week performance is indicative of a quiet holiday focused trading week.
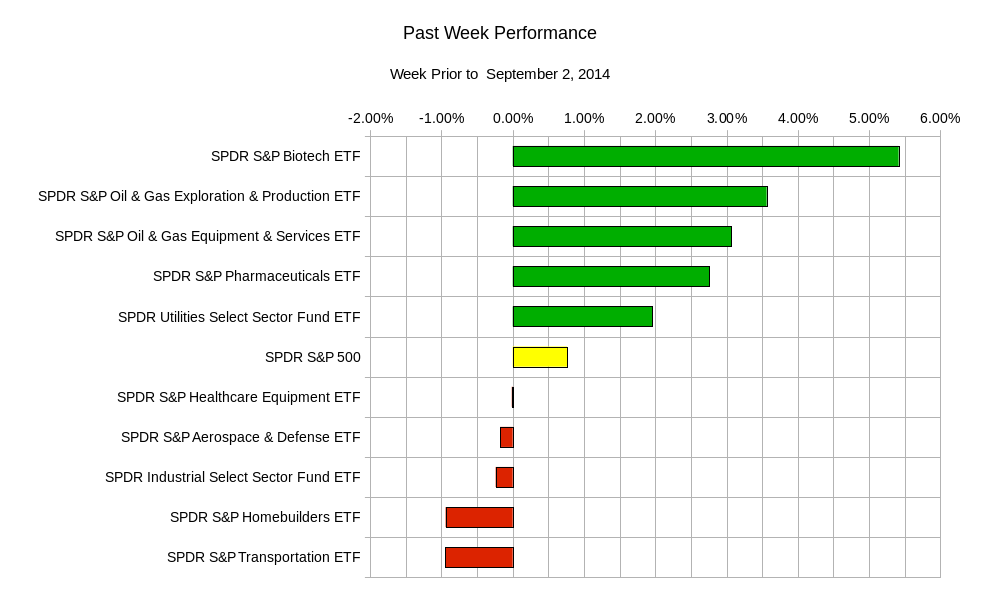 In this graphic we see a similar trend from the summer where negative returns were muted when compared to positive returns.
The rest of the shortened week will bring a few central bank rate decisions and then lead us into the monthly US employment report. Highlights include:
Wednesday – Euro zone Retail Sales, Bank of Canada Interest Rate Decision and Statement US Factory Orders, US Fed’s Beige Book, and ADP US Employment report; Thursday – Bank of England Interest Rate Decision and Statement, Bank of England Asset Purchase Facility, European Central Bank Interest Rate Decision and Statement, US Weekly Jobless Claims, and US ISM Non-Manufacturing PMI Services Index; Friday – Euro zone Gross Domestic Product, Canadian Unemployment Rate, and US Monthly Employment Report.
In terms of trading ranges SPY, the S&P 500 ETF, may land between USD$198.40 and USD$204.00; TLT, the 20+ Year US Treasury Bond ETF, can end up between USD$114.30 and USD$117.90; GLD, the Gold ETF, can see a range from $119.60 and $124.10; USO, the US Oil ETF, may try to finish the week between $34.10 and $35.70
So how does the past summer fit into the context of the 2014 year so far? The trend of every market being bullish so far is evident if we take a hypothetical USD$100 investment in each asset class at the beginning of the year. The results are below for inspection.
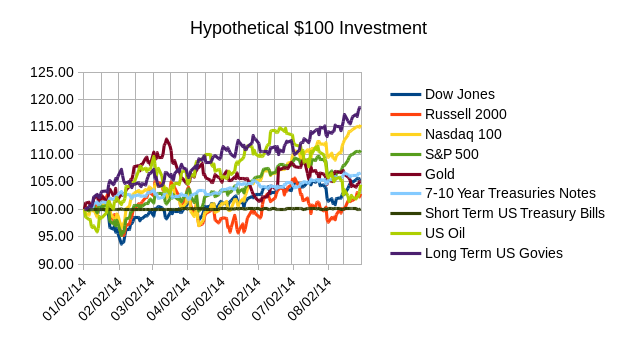 The surprise of the year seems to be the outperformance of long term US Treasury Bonds. Year to date performance of the TLT, 20+ Year US Treasury ETF, has been over 18%. Compare this with the IEF, 7-10 Year US Treasury ETF, which has made about a 6% gain in the same period. This type of performance is called a bull flattener. This description comes from the fact that bond prices have increased, thus the bullish moniker, and that longer term bond rates have dropped at a rate faster than intermediate bonds. Remember that interest rates are inversely related to bond prices. That is to say that bond prices go up when rates go down. So in other words, the prices of 7-10 year maturity US Treasuries has gone up much less than the prices of longer 20+ Year maturity.
This is interesting because this type of action usually occurs when long term growth and/or inflation expectations are falling. This seems to go against the idea that US rate increases are coming within a year and that the US economy is steadily recovering.
Or does it? Perhaps it only signifies a one sided fixed income bond market where traders have been hedging their 10 year treasury bets with longer term 20-30 year treasuries. In practice that would look like a trader selling short 10 year bonds and buying long 30 year bonds. The trader believes the 10 year treasury will go down in price (perhaps due to increased inflation) but to protect themselves from things going wrong they buy longer term treasuries just in case. This technique is called hedging. This reduces their profits if things go according to plan, but it also limits downside pain when things do not go quite as planned. If traders were fully hedged in this scenario, the mathematics would lead to about half of the money earned by selling 10 year treasuries being used to buy 30 year treasuries. Sell $100 worth of 10 Year treasuries, then buy $50 worth of 30 Year Treasuries. The current price action has shown that traders would have been protected if they only used a third of the money from selling 10 year treasury bonds. In other words the ratio used to hedge mathematically hasn’t exactly held. Therefore those traders who sold the 10 year treasury have made more money from their hedges (insurance policies) than they have lost on their initial investment thesis. This type of trade is also called a spread trade. Traders count on the change in the difference in yield rates of the two different maturities of bonds.
US treasury trading has turned out to be a positive sum trade. Traders with different views have been able to profit from the same outcome. This is an ideal outcome. While it does not happen as often as desired it is the type of market and strategies that you should pursue to increase your probability of profit.
Good luck and trade rationally.