

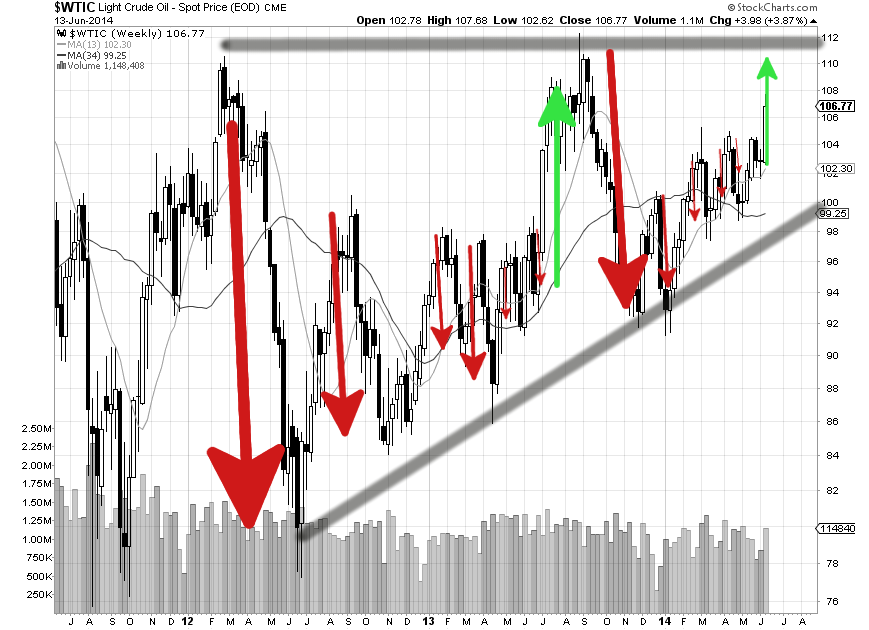
Turning our attention to oil, West Texas Intermediate (WTI), we can see that the recent rally had actually begun to build before the recent situation in Iraq came to the forefront of oil traders. In the chart below you can see how the downdrafts within the positive tend have a somewhat cyclical pattern. The length or magnitude of the down moves (highlighted with red arrows) tends to get smaller before a large breakout (highlighted with green arrows) occurs. Since just before the start of the new year the red downdrafts began. The downdrafts were smaller and smaller as time goes on and we now appear to be in an upward phase. The recent news out of Iraq is only increasing the liquidity of oil and making it easier for sellers to sell to a wider audience.
If the last period of sectarian violence in 2006 through 2007 is any indication of the near future of oil prices, speculators may be in for a disappointment. While an upside move to USD$112 and above is reasonable, it would be most likely be short lived if it happened. Just like the rally highlighted by the green arrow at the end of the summer of 2013, the rally can be taken away to start a new cycle. The difference here is that a higher floor for prices has been established. Those who are not committed to being bullish or bearish on oil prices might assume prices to trade between USD$114 and USD$100 in the very near term.
Option writers could be poised to take advantage of the increased liquidity in oil. Although news will focus on “stability” stories, the volatility of oil was 75% of its normal value during 2006 through 2007 as compared to 2004 up to today.
| During 2006-2007 | 2004-Today | |||||
| Equivalent Move (Today’s Prices) | One Day Periods | One Week Periods | Two Week Periods | One Day Periods | One Week Periods | Two Week Periods |
| Maximum | $113.55 | $118.23 | $119.19 | $125.82 | $157.26 | $156.31 |
| Average | $106.77 | $106.76 | $106.76 | $106.84 | $107.13 | $107.46 |
| Minimum | $101.64 | $98.13 | $92.34 | $93.92 | $73.75 | $76.00 |
| Standard Deviation | $1.96 | $4.08 | $5.45 | $2.50 | $5.60 | $7.44 |
Certainly there were other forces at work in the oil market in the above time frames. However, It is important to put market moves in context so that you can set realistic goals for your trading.
Good luck and trade rationally.