

Is the sell off over? Has the market flushed out the weaker players by instilling fear? Or is it just about to entice some sidelined investors into buying into a trap door?
Charts Courtesy of Yahoo Finance
Whichever way the market turns there are no shortages of catalysts for the next move.
Earnings this week will be in focus as about 125 of S&P 500 companies report their third quarter earnings for 2014. If expected earnings growth are confirmed then we may see three types of buyers entering the market.
Buyers may come from the likes of traders who are looking at specific equity stocks who have met or exceeded earnings expectations.
The other type of buyer that could enter the market might be the corporations themselves. Companies could see the recent sell off as an opportunity to buy back their own stock. The motivating factor would be to appease long term stockholders by returning capital to them.
The third buyer might be desperate money managers that did not protect profits enough and might be desperate to squeeze in one more quarter’s of profits before the end of the year.
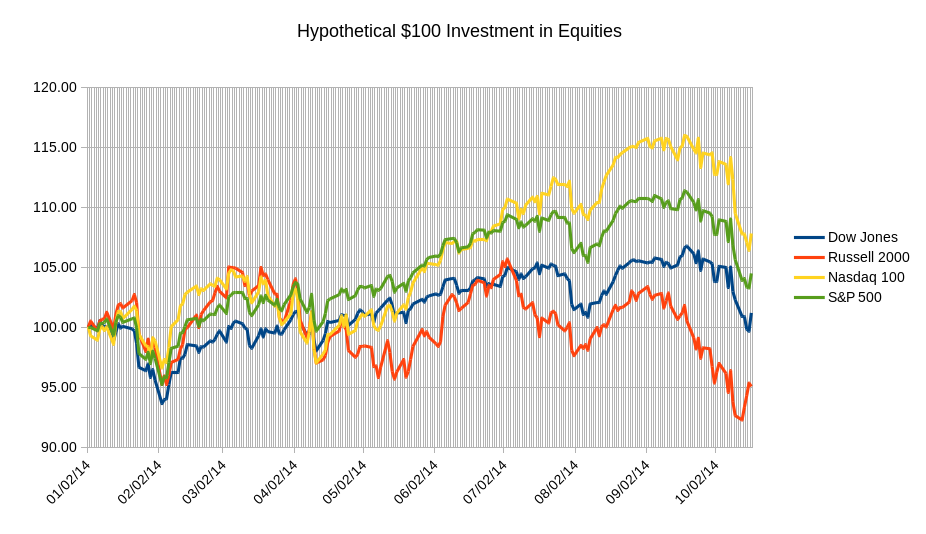
The past week saw a market searching for a bottom. Amid the volatility driven by fears of recession in Europe, Ebola virus, and an end to the US asset purchase program, the major indices saw a bounce that started to form on Wednesday. Particularly, small cap names, which are viewed as riskier assets, rebounded strongly. However, the index has severely under-performed this year. The recent uptick should be taken with a grain of salt. Perhaps the uptick represents money managers looking for some sort of convergence of the equity indices. At this late stage of the year, if one had to choose an index, perhaps the Russell, comprising of small cap names, makes the most sense. If the indices do converge via a continued flat or down market, the Russell will have to pull itself up more to meet the others. If the market takes off, the Russell would appear to be a bargain. For comparison take a look at the graphic below:
 While the divergence among the equity indices is not as noticeable on a daily basis, the volatility of the changes in each one has produced significant performance differences between the equity indices throughout the year. An even more interesting graphic is obtained by grouping the equity indices together and comparing their performance against a group of US Treasury Bonds of varying maturities and other asset classes.
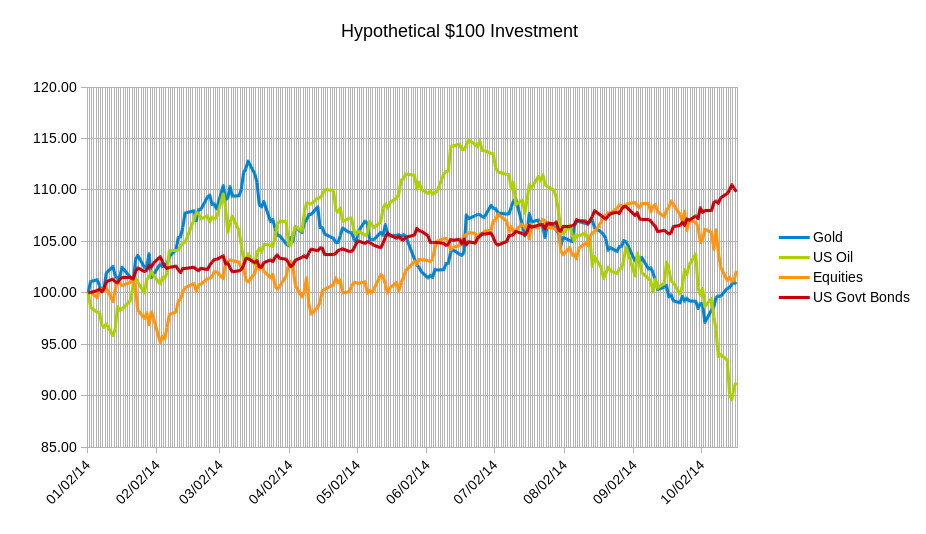 It is apparent that for all the glory and work the equity market has done in the past few years, investors so far in 2014 should be disappointed. As a matter of fact, if one were to ignore all of the media hype this graph would paint a picture of a slowing global economy since the summer. The steady rise of US Government Bonds and the sharp decline in oil would resemble a lack of growth in developing markets. Pretty interesting since that premise was the backdrop very early on in the year.
So where can the equity market go from here? It all depends on the viewpoint of course. However, if the bull market is not over then there may be reason to be optimistic. The recent pullback has been just shy of the much talked about 10% market correction. The SPY, S&P 500 ETF, had sold off until it closed 7.3% below the highest close. However, of important note is that on one point on Wednesday, the SPY was 9.9% below its all time intra-day high. Then the support seemed to kick in. With last Friday’s reversal, the ETF closed at only 6.2% below the highest close. So maybe the correction for all intents and purposes is over and it lasted minutes during last Wednesday’s trading session.
Along the path of short lived corrections, one should inspect the weekly chart of the SPX, S&P 500 index. Here you can see that every time the index broke below a moving average line the decline lasted only for a week and quickly reversed itself as highlighted by the arrows in the graphic below.
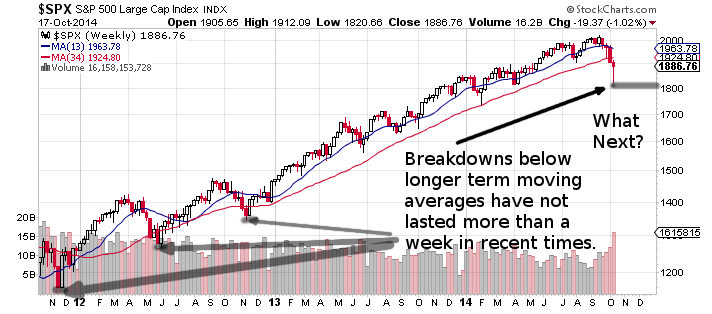 Chart Courtesy of StockCharts.com
If you look at the last two years of history It would appear that at least the 1800 level might be safe for a short while at least. Bullish investors hope that this is the case. Well where did the money pour into this past week? The sector rotation graph below tells a story with two major themes.
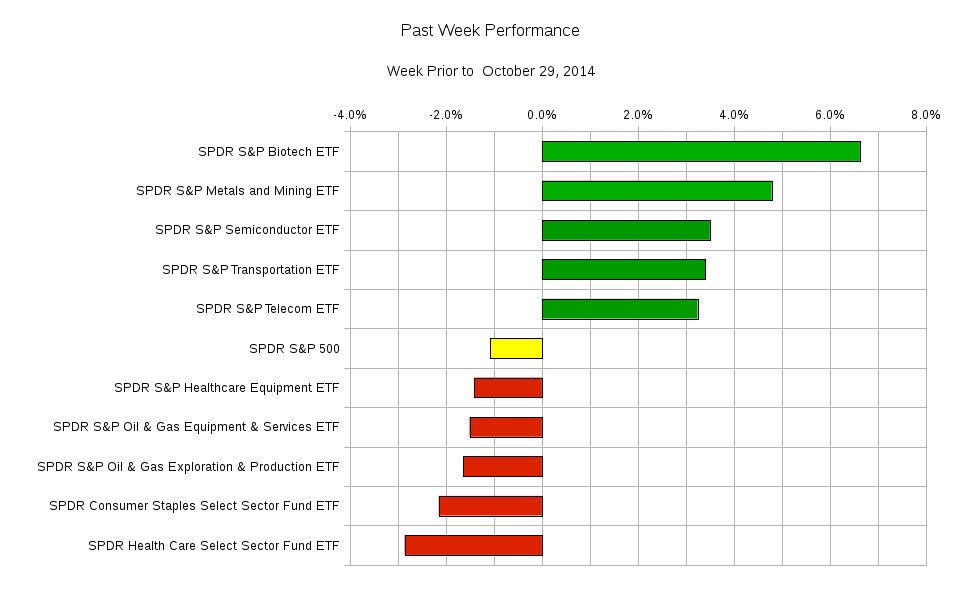 The first theme is the major drop in oil prices affecting the oil production and services sectors. Since the price of oil is a major expense for transportation and mining companies, the reduced costs might translate to higher profits for those sectors. At least that is what can be implied by the performance of the mining and transportation sectors.
The other theme is the selling of “safer” assets such as consumer staples and health care coupled with the buying of riskier sectors such as telecom, semiconductors, and biotech. Again this story does not quite correlate to an imminent market meltdown.
The upcoming week will bring more company earnings data than economic data. This might cause the indices to quiet down while traders focus on individual names. The highlights this week include:
Monday – German Producer Price Index, Earnings from Apple, IBM, Chipotle and SAP; Tuesday – US Existing Home Sales, Earnings from Coca-Cola, McDonald’s, Intuitive Surgical, and Kimberly-Clark; Wednesday – Australian Consumer Price Index, UK Bank of England Rate Decision and Minutes, US Consumer Price Index, Canadian Interest Rate Decision and Policy Statement, Earnings from AT&T, EMC, Boeing, and Yelp; Thursday – UK Retail Sales, US Initial Jobless Claims, Earnings from Amazon, Microsoft, Caterpillar, General Motors, Credit Suisse, 3M, Daimler, and Occidental Petroleum; Friday – UK Gross Domestic Product, Earnings from Bristol-Myers Squibb, Colgate-Palmolive, Ford, Procter and Gamble, and UPS.
In terms of where some of the major ETFs might close by the end of the week: SPY, the S&P 500 ETF, might land between 185.10 and 191.90; USO, the US oil ETF, may end between 30.40 and 32.20; TLT, the 20+ year maturity US Government bond ETF, may see anywhere between 118.40 and 123.00 by the end of the week; GLD, the gold ETF, may land between 116.00 and 121.60; IWM; the Russell 2000 ETF, may land in between 104.50 and 109.70.
Despite the various reasons to be optimistic on the equity market it is impossible to predict what will happen. You can only look at when the story of probabilities favors your trading style.
Good luck and trade rationally.