

After another touch of all time highs, the equity market took a spill. Things looked like they perked up on Friday. The question remains if the equity markets can match the action of the US treasury markets.
Charts Courtesy of Yahoo Finance
Last week saw equity markets stuck in neutral until late in the trading session on Wednesday. The selling began and continued into Thursday. Friday began as a roller coaster ride but then the last two hours of trading were decidedly bullish. For example, the Russell 2000 index was down 0.7% in the early going only to finish up 0.6% on the day.
Mixed signals from economic data are partly to blame. A leading hedge fund manager voiced his concerns over the current market and was oft-quoted this week as saying “one shouldn’t be too frickin’ long right now.” Regardless of whatever sensationalism these types of quotes take on and how the media harps on them, there was little reason to get excited about equity markets.
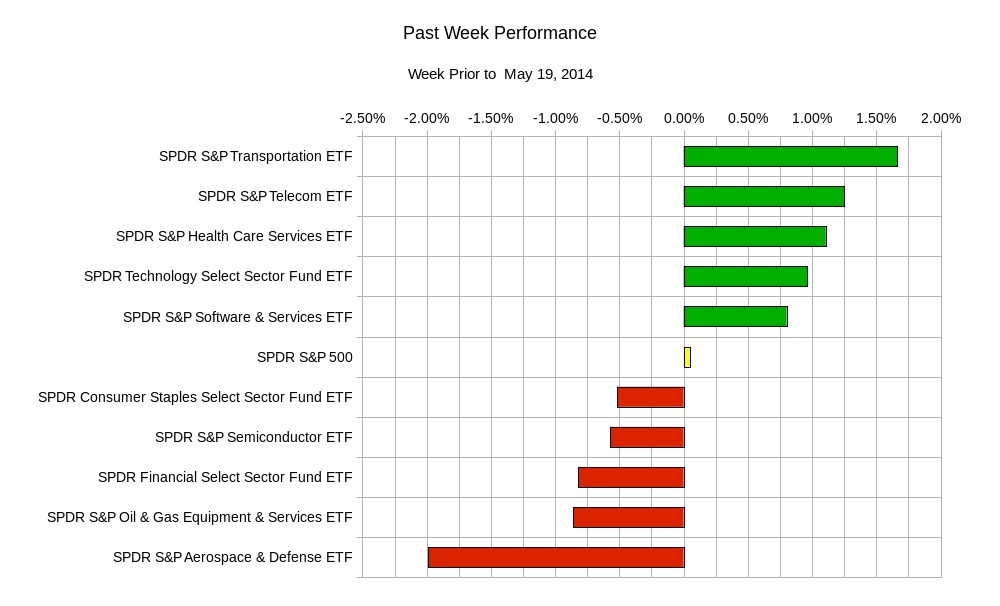
The economic data showed a small increase in inflationary measures in the US. Housing Starts in the US increased. US initial weekly jobless claims decreased to lows not seen since 2007. However, US Retail sales in April, announced on Tuesday, were weaker than expected. The treasury market started a relentless bullish charge towards the end of the week. The lesson learned from the equity markets is that economic conditions are not horrible. However, conditions are not so strong as to push the equity markets much higher in a short period of time. Keep in mind that you read the phrase all time highs more frequently than lows. It is the pace and the sector rotation that has kept frustrating impatient bulls. Speaking of the sector rotation…
The upcoming week is light in economic news. More focus will be on the Central bank chatter from the US, UK, and Japan on Wednesday. This week also leads into the beginning of the unofficial summer trading season. US markets will be closed next Monday for Memorial day, with most traders running out the door either this Thursday or early Friday to start their holiday.
Tuesday brings UK Consumer Price Index; Wednesday – Bank of Japan interest rate decision and policy statement, Bank of England Meeting Minutes, and US FOMC minutes; Thursday – UK GDP for the 1st quarter of 2014 and US initial jobless claims; Friday – Canadian Consumer Price Index.
Without any news to excite the equity markets, it may be a time of vulnerability for equities. The continued perception of equity markets not being able to reclaim the momentum of 2013 may start to weigh in. Also the S&P 500 has re-entered the trading range which has held it hostage for the past few months. There is no reason to panic and think that there will be a significant collapse or correction. If you have not noticed the Russell 2000 has already touched the so called “10% correction level”. The index has breached and is very near 10% below its most recent high attained in the beginning of March. This alone has not caused a panic sell off. Shifting our focus back to the S&P 500, it seems that any “surprise news” can trigger more selling. Looking at recent support levels, we can easily see the $SPX index reach the 1848 level and still be in an overall bullish trend. Again, you should increase your expectations of the equity market taking a breather as there is really no reason it should charge higher at a swift pace. 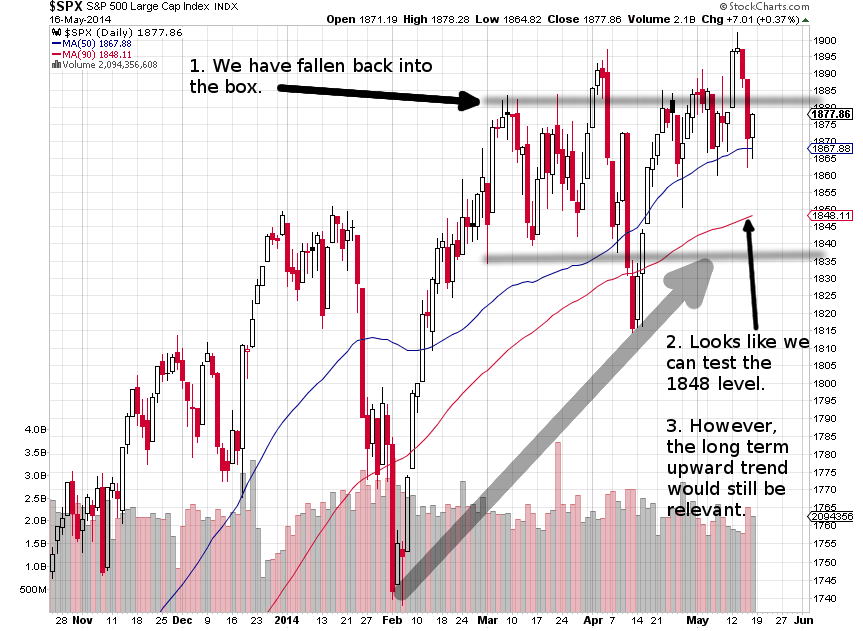 Chart Courtesy of StockCharts.com
The real action might be in US Treasury markets. Central Bank policy meeting minutes will be released for Japan , the UK, and US on Wednesday. In terms of interest rate products, it appears that the front runners for policy changes are the ECB, which is most likely to decrease rates and the BOE, which is most likely to increase rates. The uneasiness of the equity markets, geopolitical fears with Russia and Ukraine, mixed inflation signals have all contributed to the rally in US treasuries. It was not even two weeks ago that there was an underwhelming 30 year US Treasury bond auction that scared fixed income investors away. A look at the long term weekly chart of the TLT 20+ Year US Treasury ETF and it is clear that the longer maturity bonds have steered up and away from the base they have formed around mid summer of 2013. Despite the popular notion that inflation will force bond prices to tumble, prices have remained strong this year. It appears that the next major move will be dictated by time. Will a flight to safety investments caused by weakness in the equity markets or some geopolitical factors push bond prices higher? Or will looming Central bank policy interest rake hikes give investors a reason to pause? Both the ceiling and the floor look attainable.
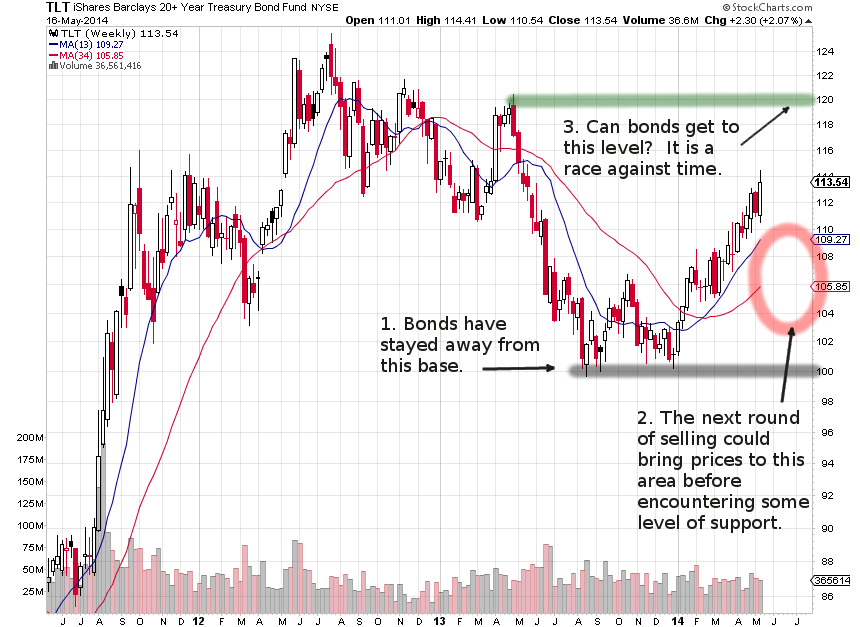 Chart Courtesy of StockCharts.com
A look at the shorter term daily chart and it may appear that the recent spikes up might be too much too soon. Perhaps a shorter term equilibrium brings the TLT ETF to the 110.50 area without giving any clues as to what might happen in a longer time frame.
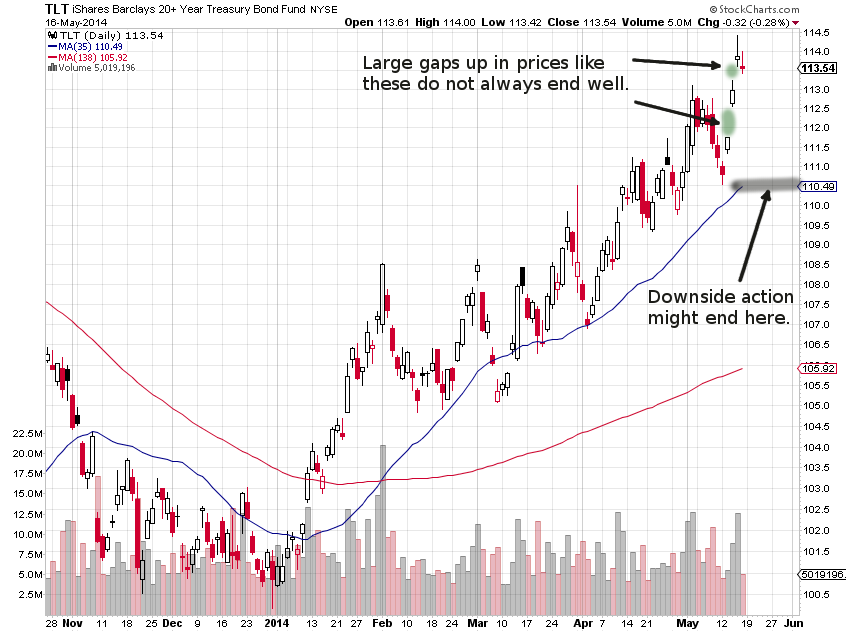 Chart Courtesy of StockCharts.com
If you have not been paying attention to the US bond market you might have been missing out on better opportunities to profit than you think you have in the equities market. Always try to follow other markets. When one market is giving you trouble, your investment game plan may work in another.
Good luck and trade rationally.