

The end of the first quarter of 2015 is upon us and while the world seems have changed over a few times over, markets have kept up their trends. The question is how do you react to more of the same when you feel like something should be different?
Charts Courtesy of Yahoo Finance.
To say the equity market has been choppy and that oil is not showing signs of recovery yet is stating the obvious. With interest rate hikes on the horizon for the US, the more relevant question maybe how have the markets maintained the status quo as opposed to following one of the other paths traders have predicted.
Equity markets have fulfilled the promise of bouncing off of moving averages as of late, but have failed to stay above water. The past few days have seen some decisive selling quickly negating an uptick that took about 7 trading days to form in only two days. Only to have a strong recovery yesterday. In the spirit of “more of the same” the market is again approaching all time highs when looked at from a longer time frame.
Let us examine the SPY, S&P 500 ETF. Looking at a chart of daily price movements, if the shorter term moving average (depicted as the blue line in the graph below) moves below the longer term moving average (depicted as the thin red line in the graph below), we may be set up for some temporary upwards pressure. The past few patterns have shown us that. Though some patience is required and some selling pressure ensued, both times these averages crossed paths the market has rebounded in a strong way. We seemed to be poised to make the same move again. Will the third time be the charm?
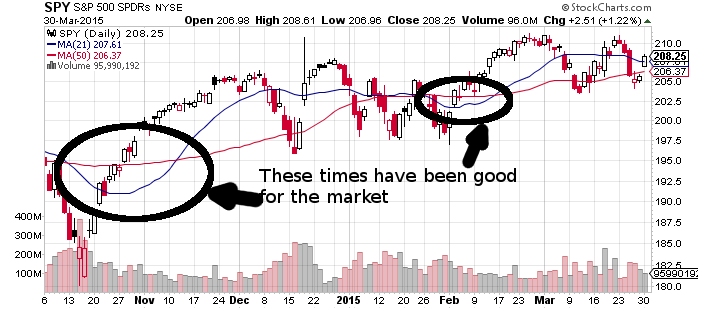 Chart Courtesy of StockCharts.com
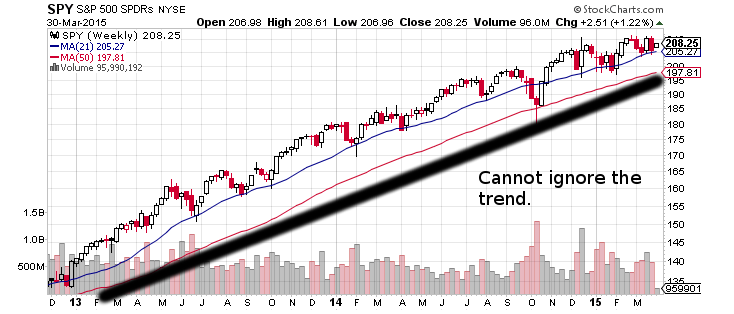
When put in context with a weekly chart of the SPY ETF, we see the impossible to ignore bullish behavior of the past few years.
 StockCharts.com
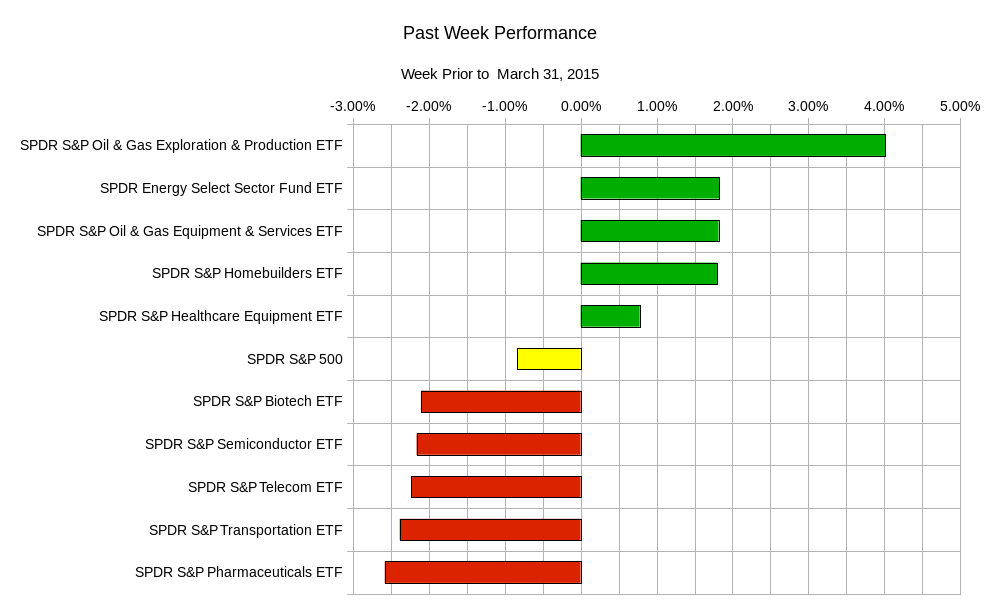
In terms of the past week performance we see some interesting rotations out of the usual outperforming sectors like biotech and pharmaceuticals. We also see money flow into oil and gas production and out of transports. Almost as if the market was anticipating an uptick of oil prices.
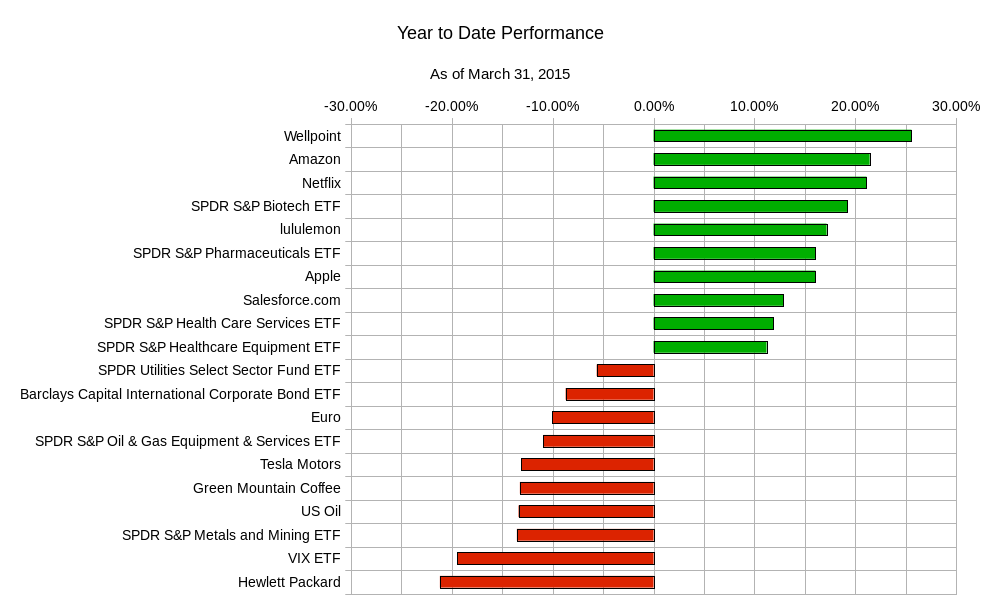
 As the quarter draws to a close, the year to date can be summarized with the following table.
 While this week has a number of economic report releases, including the monthly US jobs report, things may quiet down very quickly due to the Good Friday holiday. While equity markets will be open Friday, most fixed income markets will be closed. Most traders will be on holiday this week or next. The economic news of the week will include:
Monday – UK Consumer Credit, Euro-zone Consumer Confidence, German Consumer Price Index, US Personal Spending; Tuesday – New Zealand Business Confidence, German Unemployment Report, UK Gross Domestic Product, Euro-zone Consumer Price Index, US Consumer Confidence, Japan Large Manufacturing Outlook; Wednesday – US ADP Employment Change, US Manufacturing PMI, Japan – Foreign Investment in Japan Stocks; Thursday – Australian Trade Balance, UK PMI Construction, US Weekly Initial Jobless Claims, US Factory Orders, Euro-zone European Central Bank Meeting Accounts; Friday – US Monthly Employment Report
For the week, the popular ETF ranges will be:
| ETF Ranges for Week Ending April 3, 2015 | |||
| Ticker | Ticker Name | Lower Range | Upper Range |
| SPY | S&P 500 ETF | $203.90 | $211.70 |
| QQQ | NASDAQ-100 ETF | $104.40 | $108.90 |
| IWM | Russel 2000 ETF | $121.70 | $127.80 |
| TLT | 20+ Year US Treasury ETF | $125.50 | $130.50 |
| USO | US Oil ETF | $16.60 | $17.70 |
| GLD | Gold ETF | $110.50 | $116.20 |
Regardless of what your opinion or feeling of how things “should” look, you should be more concerned with how things are shaping up to look. Trying to predict or adapt too early to a market or trend that hasn’t formed is a sign of emotional thought processes taking over when logic and vigilant monitoring should be prevailing.
Good luck and trade rationally.