

Has the sideways trading in the S&P 500 frustrated you? Perhaps it has saved you by keeping your mistakes manageable. Maybe you have been selling options to sell volatility to benefit from this range bound trade. Whatever the case hopefully you are not lulled into the trap of complacency.
Sideways trading ranges can be deceiving because all of your ideas and trades magically seem to work and every trading model seems to be accurate. It may also keep you in a trade longer than you expected. Even if the S&P 500 continues to trade in a range by now you should be asking yourself if your game plans are working and if your assumptions still hold.
Last week the S&P 500 trudged through another week of seeing action intra-day only to end up not very far from where it started the week. However, this week there are some signs showing the potential for a more pronounced trend to appear.
One of the more recent signs may have been in place since the beginning of the year. Let us call this the Friday effect. Typically in SPY (the ETF for the S&P 500) the high of the day is about 0.66% higher than the opening price. The close on the SPY as compared to the previous close is on average 0.04% higher. What is different about the Fridays of 2014 so far? Take a look at the table below:
| High to Open | Close to Prior Close | |
| Fridays (YTD) | 0.50% | -0.08% |
| All Days (YTD) | 0.43% | 0.03% |
| Fridays (Historically) | 0.63% | 0.03% |
| All Days (Historically) | 0.66% | 0.04% |
Well there is an interesting Friday Effect going on in 2014. Overall, the highs of the day are lower than historical values (0.43% versus 0.66%). However the Fridays of 2014 so far have fared slightly better (0.50% versus 0.43%) than all of the days of 2014 so far. Now the trick comes in looking at the close of each day compared to the prior days close. Historically the change from one day to the next is 0.04%. While historically all prior Fridays close only slightly less (0.03%), the Fridays of 2014 so far, close at (-0.08%). While the statistics are not earth shattering, they do point out a recent trend. Traders are not terribly interested in being long equities over the weekend. If they were indifferent, then the -0.08% value would be closer to the 0.03% value for Friday closes.
Another interesting artifact is the current performance of the S&P 500 versus other equity indices. For comparison let us use the ETFs that track the common equity indices: SPY (S&P 500); DIA (Dow Jones Industrial Average); QQQ (Nasdaq 100); IWM (Russell 2000).
Charts Courtesy of Yahoo Finance
If there is anything to glean from their respective charts, it’s that the other indices are not holding their own like the S&P 500 is. For most of the first quarter, IWM (Russell 2000) and QQQ (Nasdaq 100) have outperformed SPY (S&P 500) and DIA (Dow Jones). The DIA ETF (Dow Jones) is a limited index and not always a diverse reflection of the state of equity markets. However, SPY does not share the same excuse. This past week has seen a shift. The reigning champions IWM and QQQ have fallen below SPY perhaps signalling a shift in investment behaviour. This is evidenced in the chart below.
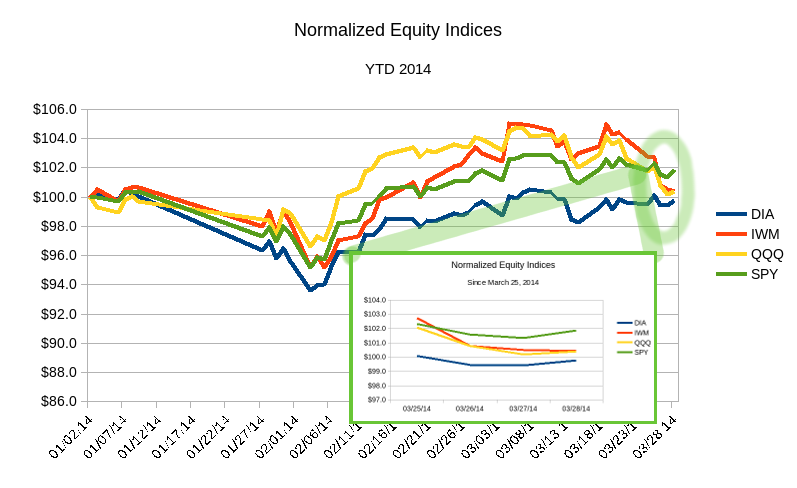 Here are the equity index ETFs since the beginning of the year. Their values have been normalized, or rather adjusted so that they start the year at $100 and their relative changes are kept the same. That way each line represents the value of an initial $100 investment in each of the ETFs. As you can see in the highlighted detail, IWM and QQQ have fallen below SPY. This has not been the case for most of the quarter.
Typical trading ranges for this week in SPY can be between $182.60 and $190.30; $85.70 and $89.60 for QQQ; $112.30 and $118.30 for IWM.
Another tell of an upcoming trend can be seen in the shift of the underlying components of the equity market. Take a look at a chart.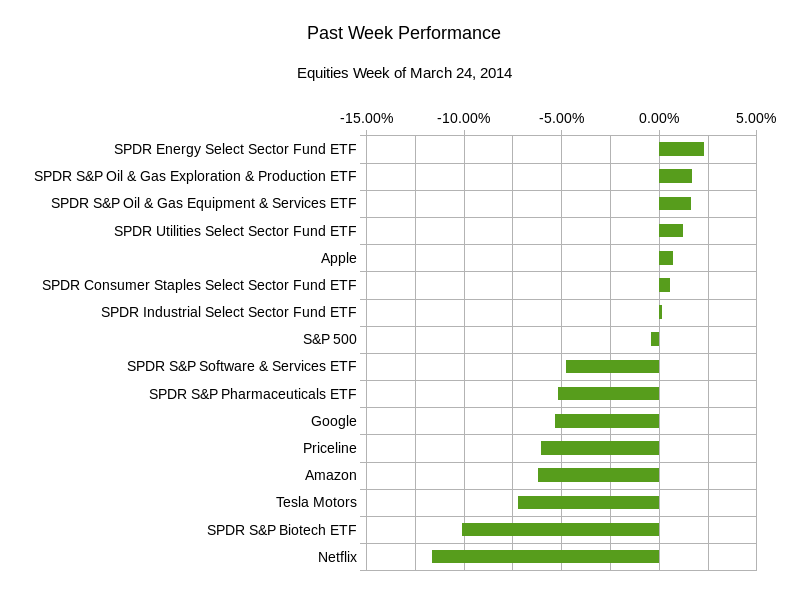 The interesting part of this chart is the type of securities that are at the top and bottom of the chart. At the top there are more “defensive, stable, and conservative” asset classes such as energy, utilities and consumer staples outperforming the S&P 500. At the bottom you see some of the more speculative asset classes that have had tremendous gains the past few years. These include the likes of retail trader favorites such as Google, Priceline, Amazon, Tesla, and Netflix. In terms of sectors, biotech, pharmaceuticals, and software have joined the under-performance party. Sometimes this view of the market is a sign of traders and investors bracing themselves for volatility or downside action.
All of the factors discussed so far should make you realize that there is a higher probability of either a downside move in equities forming or an upward move that will bring the recent under-performing equity indices in line with the S&P 500. There is more likely going to be a break in the doldrums witnessed the past few weeks. The discussion here shows that traders are beginning to have itchy trigger fingers which may result in some sort of short term trend not seen as of late.
In terms of economic data this week there are: US ISM Manufacturing Index, German Unemployment on Tuesday; US ADP Employment, Euro-zone GDP on Wednesday; US Weekly Jobless Claims, European Central Bank Rate Policy and Statement on Thursday; the ever popular US Monthly Employment Report on Friday. This busy calendar should give traders the liquidity to make their moves be it buying or selling.
Always be aware of how the markets may be evolving. When playing the game of the markets adjust your probabilities of different scenarios as things evolve.
Good luck and trade rationally.