

With the equity markets at all time highs and central bankers poised to keep the flow of “cheap” money going, the questions most people are asking are 1) When is the drop going to happen? or 2) If the drop happens when is it safe to buy? There are no easy answers nor are there any “correct” ones. The only answers are logical ones.
Charts Courtesy of Yahoo Finance.
The equity markets continue to push higher and higher. Nearly gone are all the naysayers and bearish press stories which used to try and dominate the headlines. Instead of trying to predict when and how much the market will fall, it is better to develop a game plan for how to play market drops.
Essential to any game plan is the notion of time. How long might a trend last? How long do you expect a trade to remain profitable? This second question is important because you can get a trade right and wait too long to exit before it turns against you.
That being said, let us look at the current state of the S&P 500 index. Most people like to use moving averages for a benchmark. A moving average is nothing more than the average of the last few time frames being investigated. For example, a 50 day moving average is just the average of the previous 50 trading days updated each and every day. That is why it is called moving. The average is recalculated every day. Since 1993, the average time spent below the 21 day moving average is between seven and eight trading days. What does this mean for a trading game plan? It means you should have some logic or reason behind holding a short trade for a time frame close to or longer than seven days. Let’s look at how this has worked in recent history.
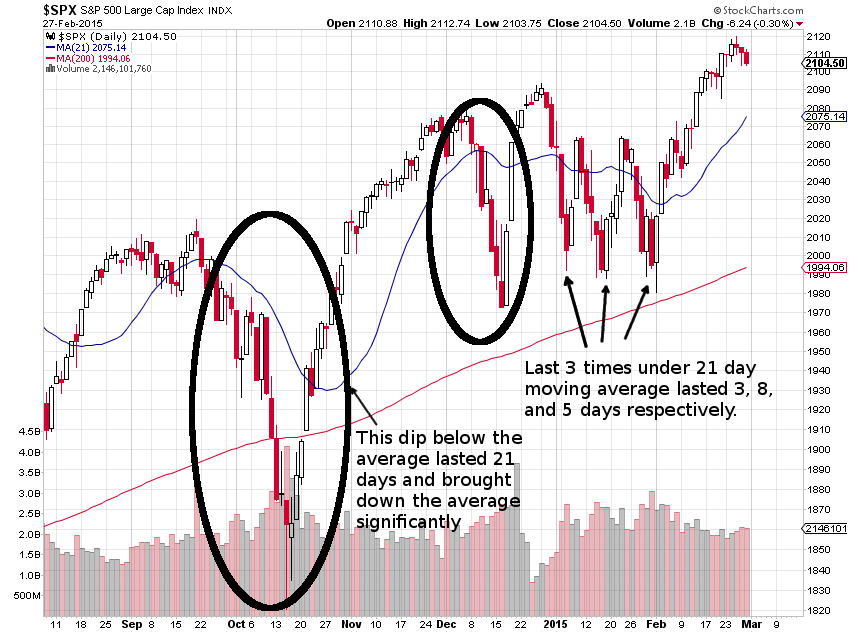 Chart Courtesy of StockCharts.com
What is apparent is that the longer the time spent below the moving average, the longer the time it takes to recover. Not surprisingly, larger upswings are required as well. Even though this is stating the obvious, it may not seem so obvious when in the middle of a losing trade. This type of behavior is one that makes the need of having a disciplined and well thought out strategy readily apparent. If you are long the market and you wait too long, you might not make it to see the winning side of the trade. If you are short the market, you need to keep the profit expectations in check or else you may find yourself on the wrong side of a “V” shaped pattern. Of course if the bearish move is on your side and is lasting longer than you expected then you will have a different perspective of the probability of win/loss game.
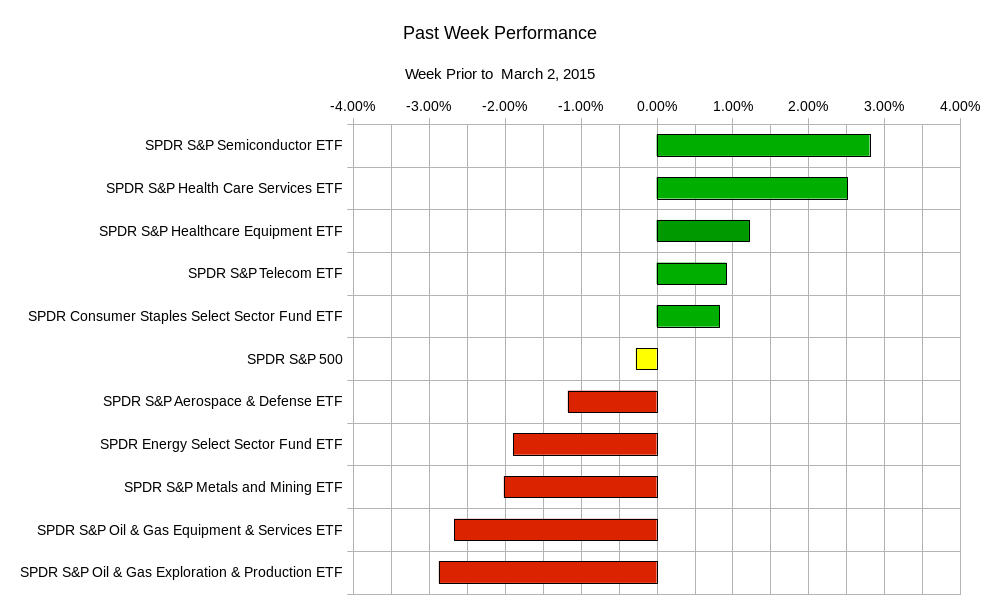
Last week we finally saw some two way markets with some sectors winning and others losing. The market, as represented by the S&P 500, barely moved. However taking a deeper look, you will notice the divergence of the different sectors. This was not an easy week to simply pick up or down.
 The year so far continues its trend of high risk premium stocks charging way ahead of broader asset classes. The strong US dollar continues to have impact on other assets classes such as oil, oil related stocks and assets such as international corporate bonds.
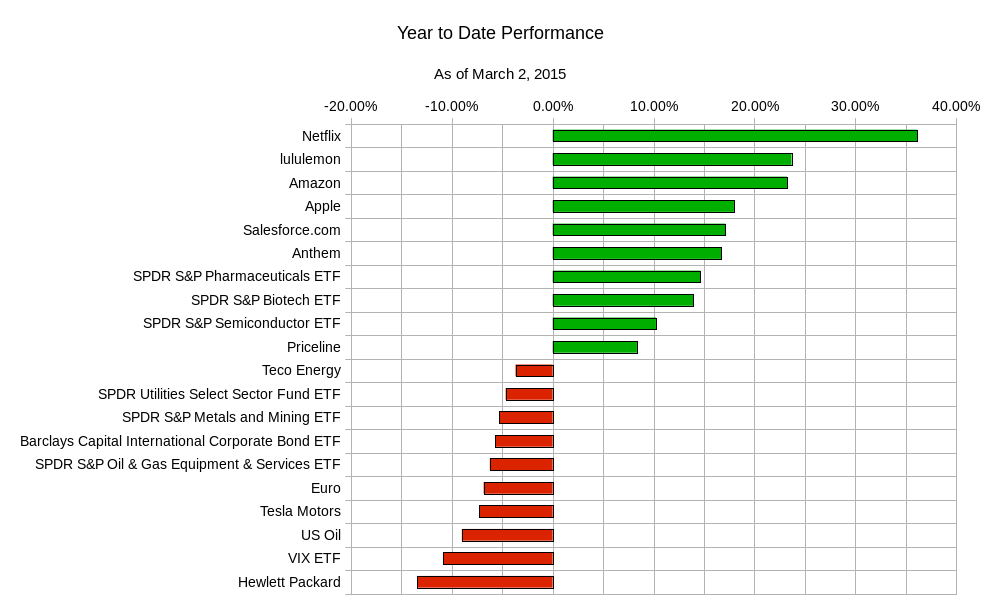 The upcoming week will include a lot of global data points and information about the health of the world economy as well as the all important, or at least exciting, US monthly jobs report. Highlights include:
Monday – Euro-zone Consumer Price Index, Euro-zone Unemployment, US Personal Spending, US Personal Income, US Manufacturing Purchasing Managers Index; Tuesday – Australia Central Bank Rate Decision and Statement, Switzerland Gross Domestic Product, Canadian Gross Domestic Product; Wednesday – Australian Gross Domestic Product, US ADP Employment Change, Canadian Central Bank Rate Decision and Statement, US ISM Non-Manufacturing Purchasing Managers Index; Thursday – Bank of England Rate Decision and Asset Purchase Facility, European Central Bank Rate Decision and Monetary Policy Statement, US Initial Jobless Claims; Friday – Swiss Unemployment Rate, UK Consumer Inflation Expectations, Euro-zone Gross Domestic Product, US Monthly Nonfarm Payroll Employment Report.
Possible ranges for the more popular ETFs are:
| ETF Ranges for Week Ending March 6, 2015 | |||
| Ticker | Ticker Name | Lower Range | Upper Range |
| SPY | S&P 500 ETF | $206.70 | $214.60 |
| QQQ | NASDAQ-100 ETF | $106.20 | $110.70 |
| IWM | Russel 2000 ETF | $119.80 | $125.80 |
| TLT | 20+ Year US Treasury ETF | $126.80 | $131.80 |
| USO | US Oil ETF | $17.50 | $18.60 |
| GLD | Gold ETF | $113.40 | $119.10 |
The need of rational and logical thinking are critical to successful trading and investing. Keeping clear of emotional decisions and staying focused on disciplined strategies will yield more predictable results from an unpredictable market.
In honor of the late Leonard Nimoy, whose many accomplishments included the portrayal of Mr. Spock. Mr. Spock, whose commitment to logic and reason was most admirable, gave us the phrase – “Live long and propser.”
Good luck and trade rationally.