

The latest US job report put some urgency in the hearts of traders afraid of looming rises in US interest rates. The days of extremely cheap capital being over will force many market participants to revisit their risk/reward profiles. What will the equity markets look like through a different color lens?
Charts Courtesy of Yahoo Finance.
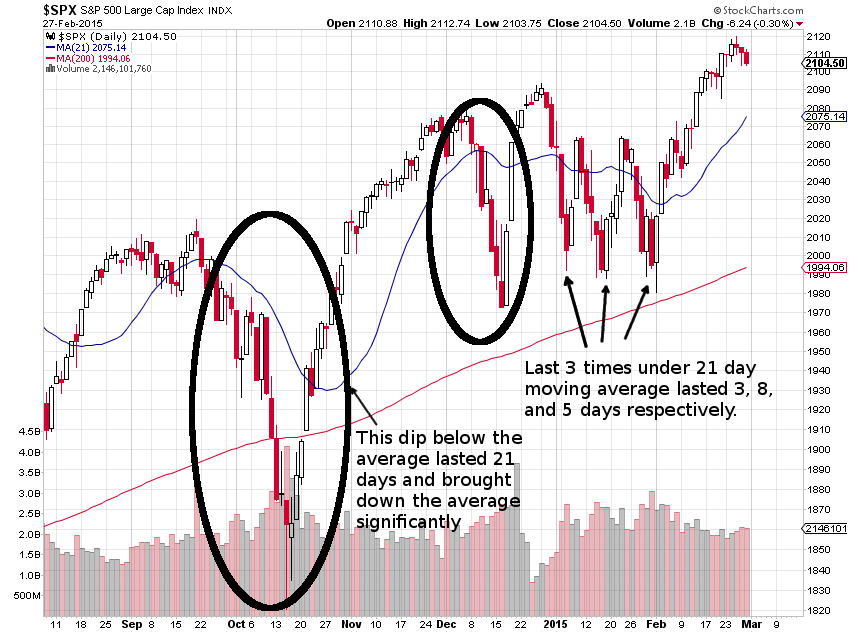
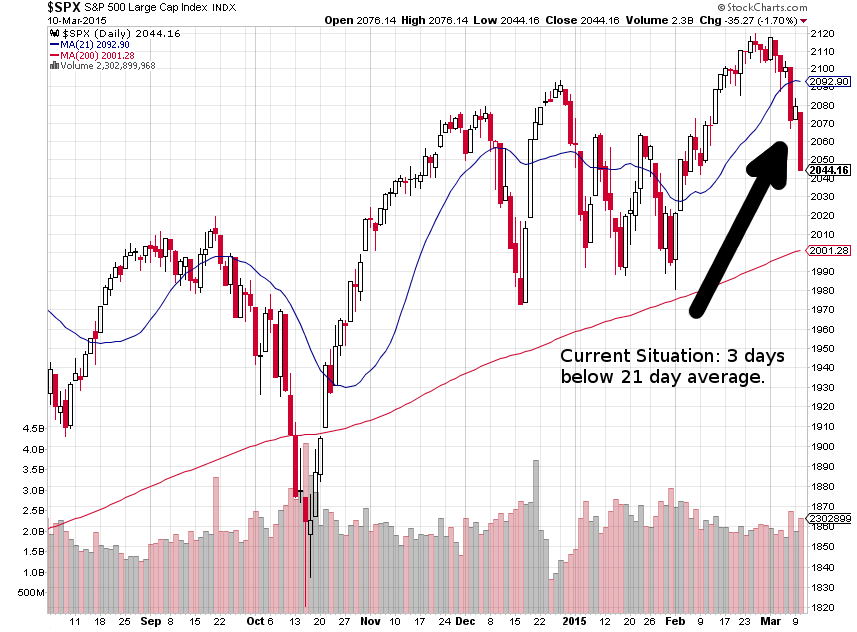
The equity market has had quite the drop the past few days. The market as measured by the S&P 500 index has steadily dropped the past few days on average volume. The SPX index has failed to recover the highs of about a week ago. This has put the index below its 21 day moving average for the past three trading days. As mentioned in a previous post, this situation usually lasts seven to eight days.
Here is the graphic from last week.
 And now here is the graphic for this week.
Bear in mind that recouping the 21 day moving average in that time frame means recouping the future 21 day moving average, not the current one. So if the sell off continues, the market will effectively reset and may continue to appear bullish, however it will show that tendency at lower price level. That does not console those who purchased at higher levels. This type of market dynamic is often referred to as a “healthy” pull back. There is nothing healthy about losing money. The longer the time spent below the average, the lower the perceived support level the market will end up with.
With rate hike fears spooking US markets, though a good economy should mean good for everyone, large institutional investors are rethinking portfolios. A good economy should mean good money for most, however it may signal the end of “easy” money. For a very long time, the flood of money from central banks have made it almost free to borrow money. This has meant banks and large institutions can borrow and place money into equity markets and make high returns with little costs. This makes it easier to “risk less” by deploying less cash since equity and fixed income returns have been skewed to the higher side. Now if any investment choice came at a fixed borrowing expense of say 3%, investors would have to make more informed decisions and may have to risk more capital to maintain current levels of income. What remains to be seen is how the US Federal Reserve Board implements their interest rate hikes and how transparent they make the process seem.
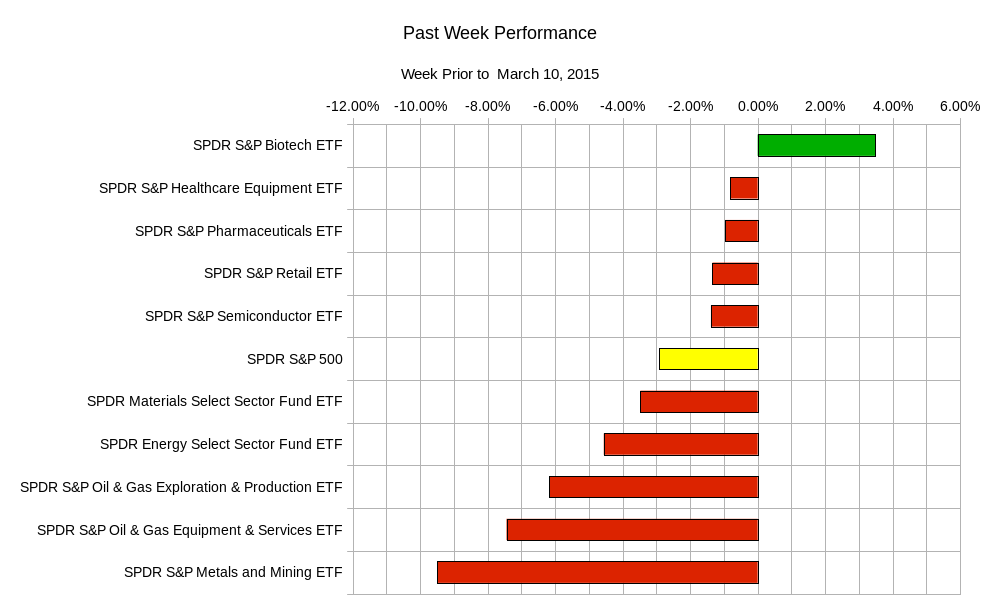
The past week’s sector rotation is as follows:
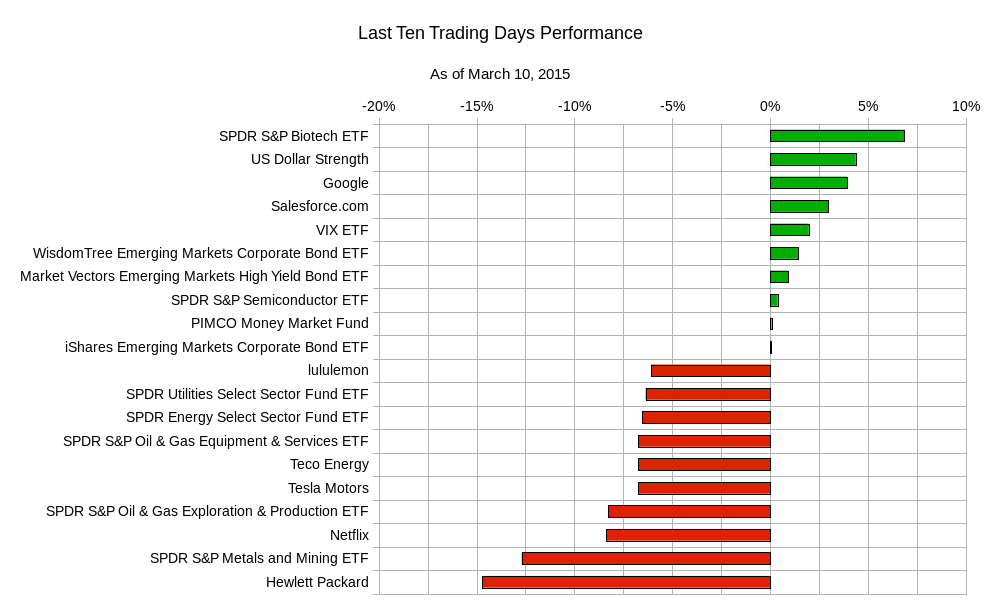
 On a broader scale, the past ten days have seen the US dollar crush every currency out there. The strength of the dollar has muted some of the losses of commodity holders since their assets are priced in US dollars. The dynamic of the dollar will have an interesting impact on asset class allocation and performance. Here is the chart for various equities and other asset classes.
 The week is light with economic data :
Wednesday – UK Industrial Production, UK Manufacturing Production, New Zealand Interest Rate Decision and Policy Statement; Thursday – Australian Unemployment Report, German Consumer Price Index, UK Trade Balance, US Retail Sales, US Weekly Initial Jobless Claims; Friday – Canadian Unemployment Report, US Consumer Sentiment Index.
Typical Weekly range for popular ETFs
| ETF Ranges for Week Ending March 13, 2015 | |||
| Ticker | Ticker Name | Lower Range | Upper Range |
| SPY | S&P 500 ETF | $201.70 | $208.50 |
| QQQ | NASDAQ-100 ETF | $104.50 | $108.60 |
| IWM | Russel 2000 ETF | $117.70 | $123.00 |
| TLT | 20+ Year US Treasury ETF | $123.90 | $128.40 |
| USO | US Oil ETF | $17.40 | $18.40 |
| GLD | Gold ETF | $109.10 | $113.80 |
Now that the spectre of higher US interest rates may force larger institutions to rethink how their portfolios are constructed and how they might trade, don’t you think its time you do the same? Start to develop tools, strategies, and investment ideas to cope with a different market landscape. Adaptability is the only way to survive.
Good luck and trade rationally.