

A new year is upon us. Where did things end up in 2015? After the weekly summary graphs are the results.
Charts Courtesy of Yahoo Finance.
Before analyzing what happened in 2015 and how we might manage expectations for 2016, let’s recap how various markets performed in 2015. Check out these graphs.
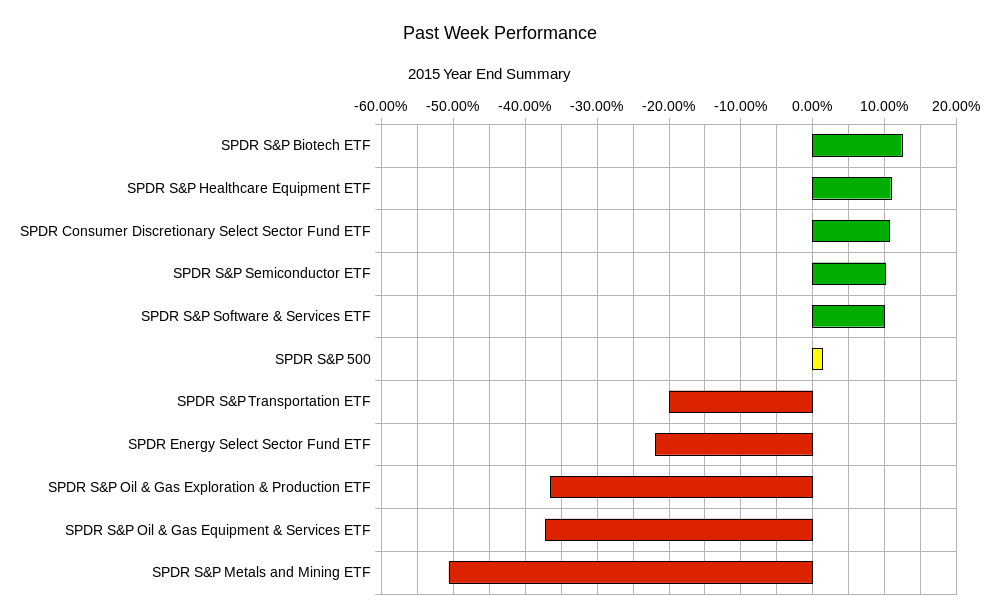
The S&P 500 sectors ended the year with mixed results. The overall index was almost unchanged by the end of the year:
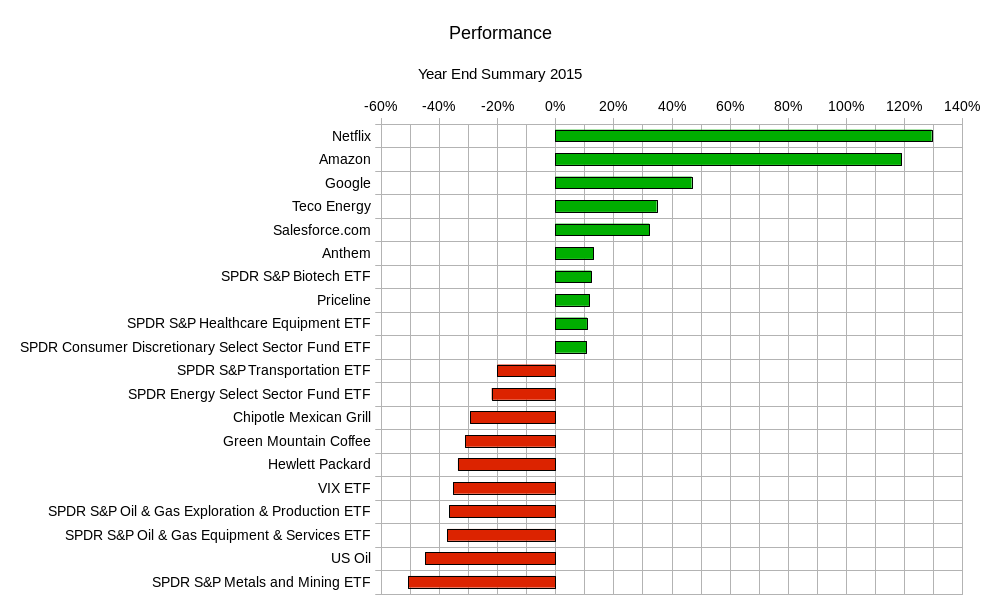
 The broader market shows more of the same with some outstanding performances and some abysmal ones.
 Taking a closer look at how equity markets ended up in 2015, we’ll invest $100 at the beginning of 2015. Here’s where ended up:
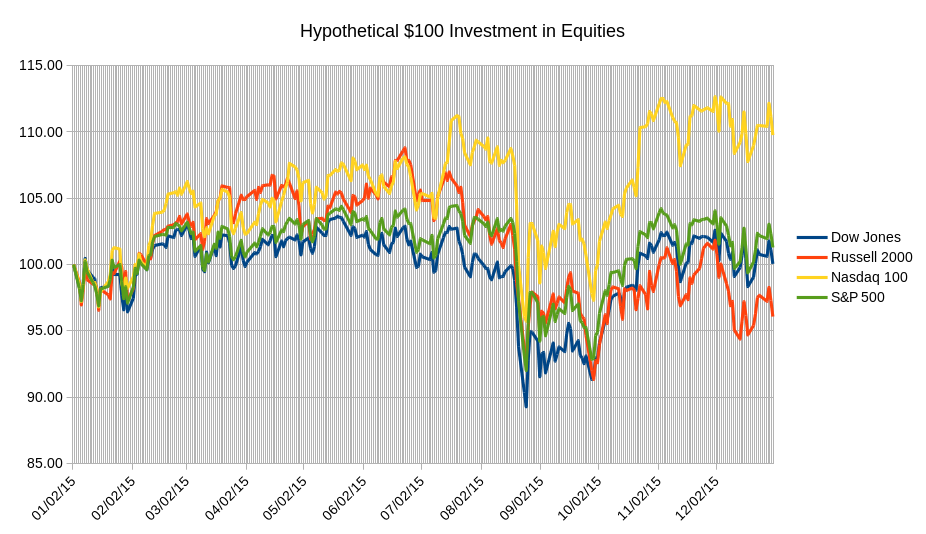 Technology heavy nasdaq was the way to go. However, was the return worth the risk?
A comparison to other asset classes:
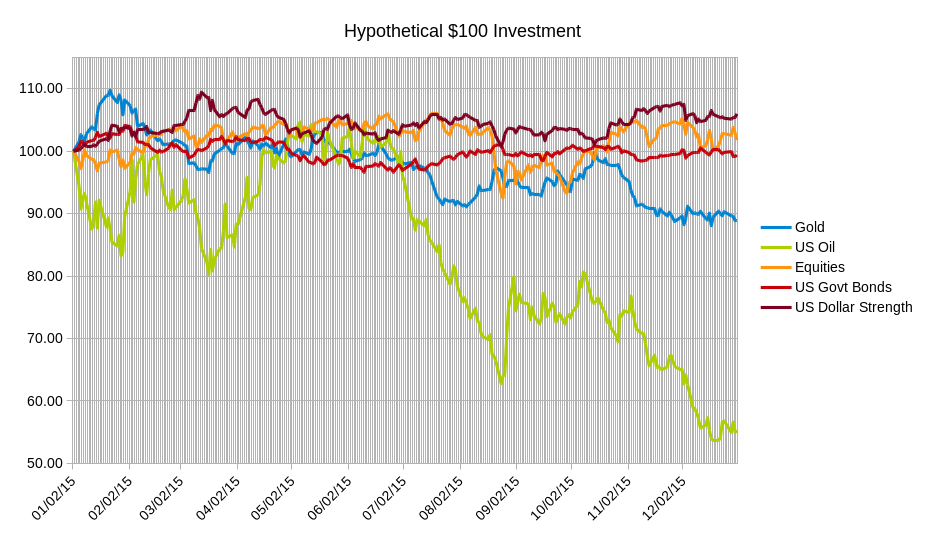 Commodities were a great short, everything else was pretty much contained.
Economic news highlights this week include:
Monday – US ISM Prices Paid, US ISM Manufacturing Index; Tuesday – Eurozone – Consumer Price Index, German Unemployment Report; Wednesday – Spain Serivces PMI, US FOMC Meeting Minutes, US Factory Orders; Thursday – Swiss Unemployment Report, Eurozone – Unemployment Report, ECB Meeting Minutes, US Weekly Jobless Claims; Friday – US Unemployment Report, Canadian Unemployment Report.
The weekly ranges for some popular ETFs are:
| ETF Ranges for Week Ending January 8, 2016 | |||
| Ticker | Ticker Name | Lower Range | Upper Range |
| SPY | S&P 500 ETF | $198.70 | $208.80 |
| QQQ | NASDAQ-100 ETF | $108.70 | $115.10 |
| IWM | Russel 2000 ETF | $109.20 | $116.30 |
| TLT | 20+ Year US Treasury ETF | $117.60 | $122.70 |
| USO | US Oil ETF | $10.50 | $11.40 |
| GLD | Gold ETF | $98.70 | $104.20 |
Stay tuned for an update on how some of the data in a year end summary can help guide you in terms of managing your expectations for the upcoming year.
Good luck and trade rationally.