

With the end of January behind us, it is time to look forward to the next few months of trading. One of the consistently looming questions is about volatility in the markets. Remember, historically January is not the most volatile month. However, there is some merit to looking at monthly historical cycles.
January is typically the worst performing month of the year. Looking back at the S&P 500 index we have tabulated the result of buying the index at the last day of the month and selling it at the end of the next month. For example, buying on December 31 and selling on January 31 averages a -1.18% return. A look at all of the months shows that we may still be in uncertain territory for bullish investors. The bulk of the positive returns tends to be from the end of February to the end of March. Historical volatility measured by the differences of the individual daily swings from the average of all daily swings is numerically lower. However, it may appear psychologically higher because of the negative mindset that tends to follow lower prices.
| Month | Monthly Return | Rank |
| January to December | -1.18% | 12 |
| February to January | -0.78% | 10 |
| March to February | 3.35% | 1 |
| April to March | 1.95% | 3 |
| May to April | -0.84% | 11 |
| June to May | -0.77% | 8 |
| July to June | 1.59% | 4 |
| August to July | -0.77% | 9 |
| September to August | 0.58% | 6 |
| October to September | -0.04% | 7 |
| November to October | 0.60% | 5 |
| December to November | 3.09% | 2 |
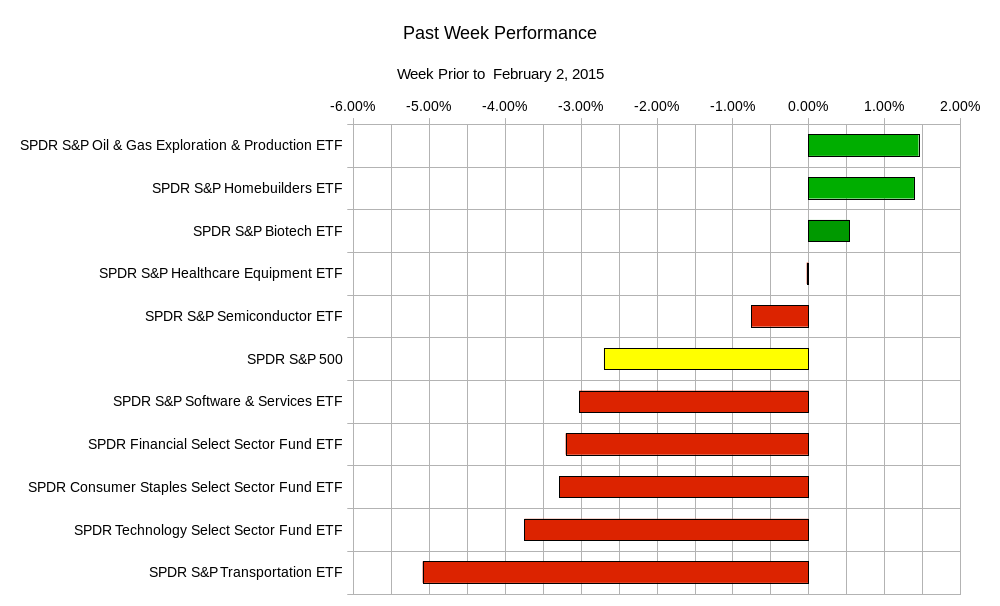
In terms of this past week, the end of the week saw a sharp sell off. The sentiments were bearish entering the weekend with the new Greek government’s future direction clouding the Euro and the European economy. The heavy selling came in at the end of the trading day on Friday. The selling also is probably a result of traders preparing themselves for the upcoming week which is chock full of economic data and earnings reports. Speaking of earning reports, the lower guidance reported by Amazon, despite its positive results, have probably put a damper on the outlook of discretionary spending of the US consumer. The upcoming earnings reports of major energy names that have been tied to the steep declines in oil prices probably shares some of the blame for the late sell off. The past week sector rotation is as follows:
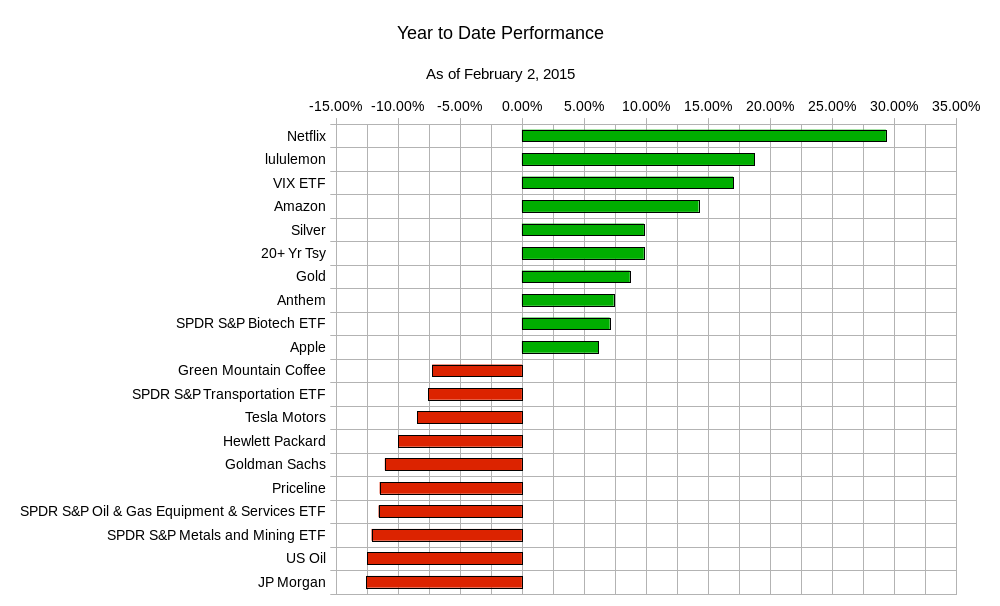
In terms of the performance so far of the first month of 2015, there is an interesting mix of winners and losers. It is hard to see a trend in the results. While perceived safe haven investments such as precious metals and US treasuries have outperformed the market, higher volatility single equity names such as lululemon, netflix, amazon, and the biotech sector have performed as well. The loser category includes the transportation sector, which should have benefited from the decline in oil prices, along with financials.
The upcoming week will bring a wealth of information which may give rise to mixed signals. It will be interesting if the market can reach a consensus on the overall health of the global economy. Usually if there are a large number of discrepancies, one would expect a less volatile but lower equity market in general. The past few years have certainly put in evidence that this is not a rule by any means. This week’s data and earnings includes:
Monday – German Manufacturing PMI, Euro-zone Manufacturing PMI, UK Manufacturing PMI, Canadian Manufacturing PMI, US Personal Income, US Core Personal Consumption Expenditure, US Personal Spending, US Manufacturing PMI, US Prices Paid, and US Construction Spending, and earnings from ExxonMobil; Tuesday – Australian Central Bank Rate Decision, UK PMI Construction, US Factory Orders, and New Zealand Unemployment and earnings from BP , UPS, Disney, Chipotle, Banco Santander, and LVMH; Wednesday – Japan Services PMI, German Services PMI, Italian GDP, UK Services PMI, Euro-zone Retail Sales, US Mortgage Applications, US ADP Employment Change, US Services PMI, and US Non-Manufacturing PMI, and earnings from GM, GlaxoSmithKline; Thursday – German Factory Orders, Bank of England Rate Decision and Asset Purchase Facility, and US Initial Jobless Claims, and earnings from Dunkin Donuts, Sprint, Yum Brands, LinkedIn, and Twitter; Friday – Royal Bank of Australia Rate Decision, Japan Leading Economic Index, Swiss Unemployment, German Industrial Production, Canadian Unemployment Report, and US Monthly Unemployment Report.
Given the amount of data, there may be conflicting views of the markets and global economy. That may rise to muted volatility, but may continue the lack of buying needed to buoy the equity markets. The ranges of some popular ETFs are as follows:
| ETF Ranges for Week Ending February 6, 2015 | |||
| Ticker | Ticker Name | Lower Range | Upper Range |
| SPY | S&P 500 ETF | $196.00 | $203.50 |
| QQQ | NASDAQ-100 ETF | $99.00 | $103.30 |
| IWM | Russel 2000 ETF | $113.30 | $119.10 |
| TLT | 20+ Year US Treasury ETF | $134.90 | $140.20 |
| USO | US Oil ETF | $17.90 | $19.00 |
| GLD | Gold ETF | $119.60 | $125.40 |
Even if lower prices scare you as a trader or investor, or if they excite you as a value seeker, be aware of the difference of perceived volatility and actual volatility. More attention is always paid to rainy and inclement weather reports, despite the fact that the weather is usually typical of the season. Don’t let the color red cause you to panic.
Good luck and trade rationally.