
The end of the year is upon us. In terms of trading, the year end should just be a phase the market is passing through. However, you should still set a resolution to be a more effective trader or investor. The scorecard is resetting to zero soon. That means prior results, both good and bad, should not be brought into the new year and either give you inflated confidence or extreme despair. The odds of a winning trade are still the same. Make it a point to stick to trades where the most likely outcome is a positive one.
Charts Courtesy of Yahoo Finance
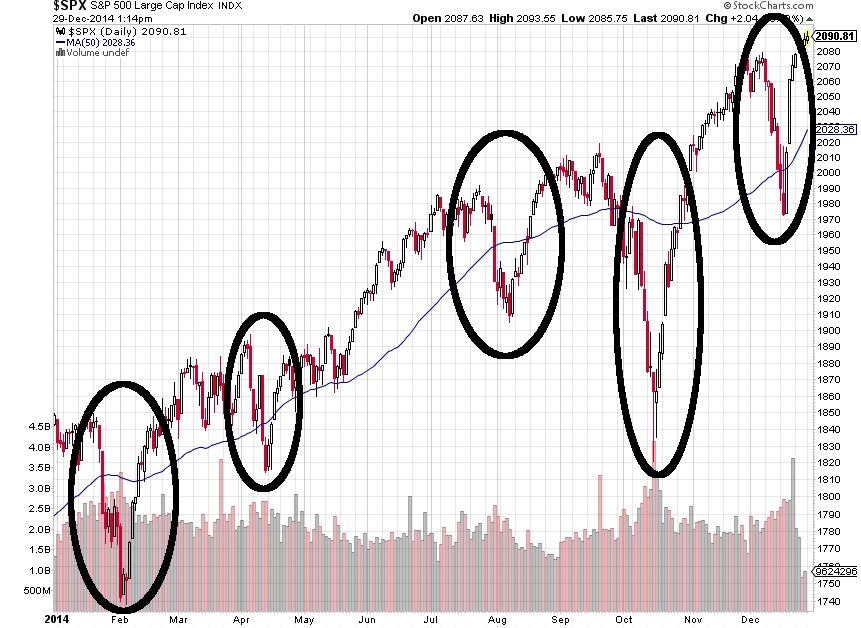
Equity markets find themselves at all time highs. Brushing off a number of “corrections” and news stories that had made it seem like the modern world is over as we know it. The resiliency of the equity markets has been quite remarkable. Every major dip was erased and quickly forgotten.
This year saw stories such as the Russian annexation of Crimea and continued conflict with Ukraine. The story of conflict continued with the rise of ISIS in Syria and Iraq. Violence in the Gaza strip was also up front and center this year. The spread of the Ebola virus and confirmed cases across continents led to worry about a widespread epidemic. There was no shortage of stomach churning and nerve wracking stories this year.
The news was not limited to catastrophes. Political unrest of the more tepid kind was also present throughout the year. The United States saw a shift in its midterm elections when the opposition Republican party won elections to give them the majority of the House and Senate in 2015. The UK held a referendum discussing Scottish independence. The wealth gap between the richest socioeconomic classes and the poorest ones are extremely wide and at the heart of many political debates.
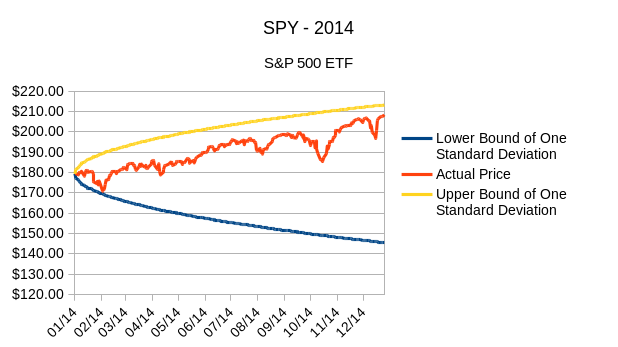
Regardless of the news, the equity market kept chugging along. Here in this graphic, despite the five large downdrafts, the S&P 500 still made gains of about 16%. That would be unfathomable if you were sitting in one of the valleys highlighted below.
 While it is not the strongest of yearly performances as of late, it should be noted that this was in light of the US Federal Reserve Bank ending its quantitative easing program. The end of quantitative easing in the US was a major topic in which investors felt that the rug was going to be pulled from underneath them. However, those with bearish tendencies were disappointed.
Here are some more year long charts of various asset classes:
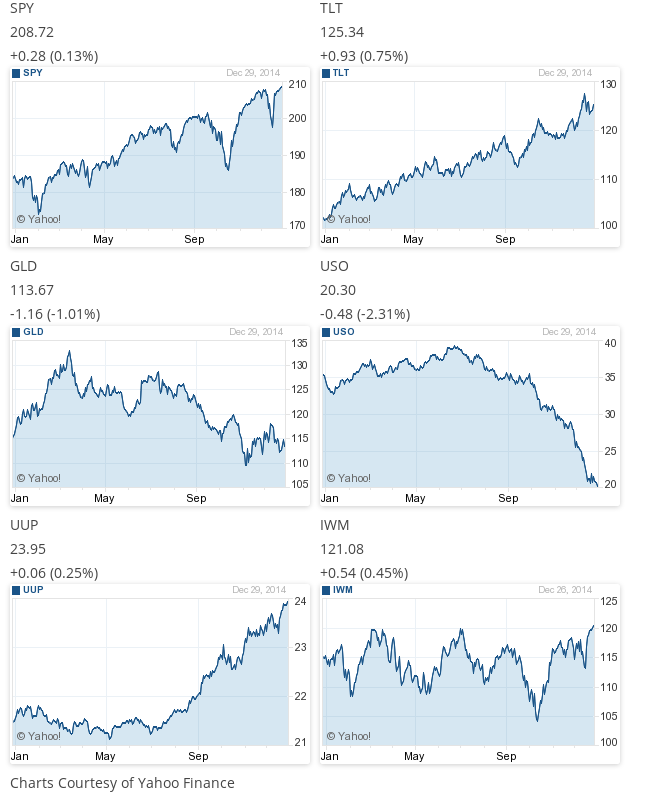 The year was a confusing one, where recessions in Japan and Europe, were in stark contrast to economic and labor growth in the United States. The central bank in the US removed money from the bond market, spoke of higher interest rates, while their counterparts were injecting liquidity and cash into markets. The strength of the US dollar has been undeniable, despite past talk of the search for an alternate reserve currency. The end of the year saw a deep slide in oil prices due to supply gluts that can only mean trouble for oil producing nations. The global outlook does not really coincide with the all time highs in equities. This year should be an interesting one as divergent economic fates seem to be a theme that is taking shape going into 2015.
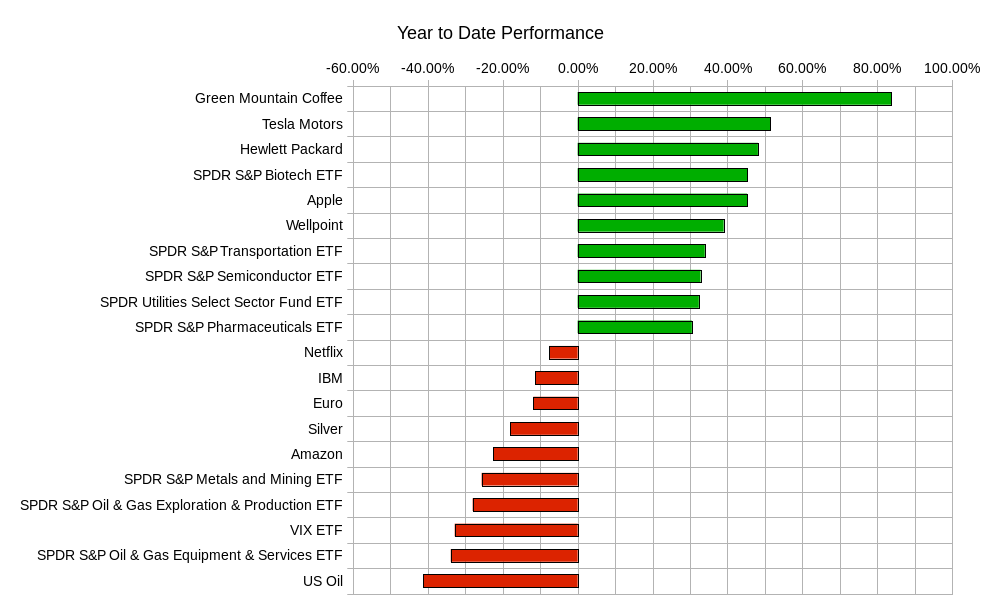
The year was an interesting one in terms of its various components. There really was no consistent theme to this year’s best and worst investment choices. Riskier names such as Green Mountain Coffee, the biotech Sector, and Tesla shared the winner’s podium with more conservative names such as Wellpoint (now known as Anthem , Inc.), the transportation sector, and the utilities sector. The losers of the year were also a mixed bag of riskier and more conservative choices. The “winners” of the selling short contest included Netflix, IBM, silver, the metals and mining sector, oil, and the VIX.
For short term traders the year has probably been a frustrating one if you were seeking larger than usual moves in the market. Despite the pronounced sell offs highlighted earlier, the S&P 500 was rather tame this year. If we put the S&P 500 performance in a statistical context, it shows that most of the fuss or noise generated about the sell offs and corrections was just noise.
For a moment, subscribe to the notion that the market can remain within one standard deviation of its mean value for no particular reason. This means that using historical data you can say that approximately 68% of the time the SPY price will stay in a certain range. This would mean that you shouldn’t blink an eye if the market was within that range. To put it in a practical context; what would happen if the weather forecast called for a 32% chance of rain and it did not rain. You would not be surprised. Imagine the one standard deviation range for a day, a week, a month, a quarter, and so on. You can see that starting from the beginning of 2014, the range projected for the various time frames would end at a lower bound of 145.50 and upper bound of 213.30. Looking at the year and this one standard deviation boundary you would see there really was no major breakthroughs or breakdowns.
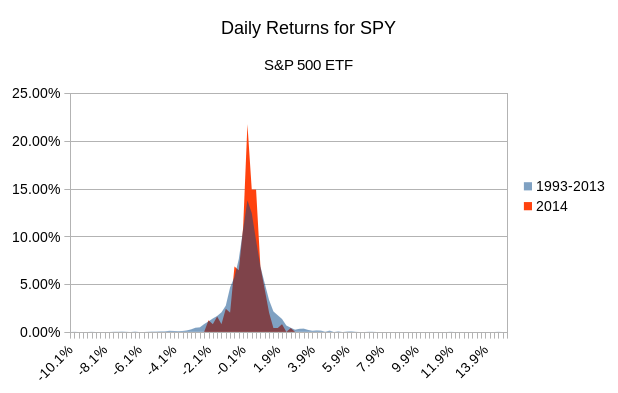
 This means the year for the S&P 500 was unremarkable. Looking at it from another statistical perspective, the daily changes in price were kept in a tighter range than usual. Comparing the histogram of the daily changes of the SPY ETF from 1993-2013 with the same histogram using data from 2014 shows how much “quieter” the SPY was this year. A histogram shows the number of times the SPY moved a certain percentage. Looking at the orange area in the graphic below you can conclude the following: The SPY, about 22% of the time moved between -0.1% and 0.16% in a day. In other words, pretty close to zero. Compare that with the blue transparent area (appears brown when superimposed with the orange area) which has moved between -0.1% and 0.16% only 13.8% of the time. The blue are has more “hits” in the areas further away from -0.1% and 0.16%. Meaning it has deviated more times from the most common observations (which are close to zero).
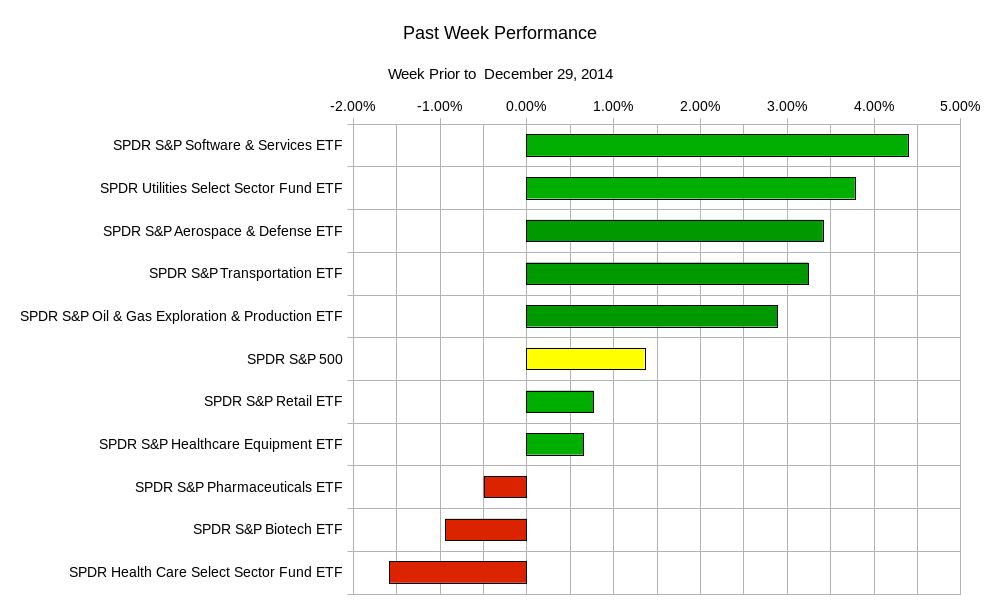
On a more recent note, the following week saw some buying in more conservative types of sectors and a bit of selling in the strong biotech and health care sectors. This probably is representative of money managers taking some profits and rotating into more dividend paying names until the new year settles in and the holiday season gives way to a more active market. Once the market shows a certain direction it is likely to see a more pronounced definitive sector rotation. The graphic below shows the rotation for the past week:
The rest of the week is light with economic data. Most markets will be closed on New Year’s Day, and there will most likely be light volume trading on New Year’s Eve. Tuesday – US Consumer Confidence; Wednesday – US Initial Jobless Claims, US Pending Homes Sales; Friday – German Manufacturing PMI, UK Manufacturing PMI, Canadian Manufacturing PMI, US Manufacturing PMI, and US Prices Paid.
If you are looking for ranges of prices you are better off thinking a week in advance. Levels for the week ending January 9 look like: between 203.90 and 214.10 for SPY, the S&P 500 ETF; QQQ, the NASDAQ-100 ETF, might land between 102.70 and 108.20; IWM, the Russel 2000 ETF may end up between 118.10 and 125.5; TLT, the 20+ Year US Treasury fund ETF, may find its closing price between 120.20 and 126.24; USO, the US Oil ETF still in a freefall, will hope to end its week between 19.30 and 21.00; GLD, the gold ETF, will be aiming to end between 107.60 and 115.40. Remember that these figures are for the week ending January 9, 2015.
The lull that occurs around the holidays is a perfect time to reflect on a year’s worth of trading and investing. It is a time to analyze and critically think about your trading performance. Given the market, that occurred were you always looking at maximizing the probability of success? In a low volatility situation, were you “spooked” too easily into getting into or out of positions? Remember “hindsight is always 20/20”, so be careful when critiquing your performance. However, make sure you are learning lessons on how the market behaves and how you are reacting to it. May you have a prosperous and positively profitable 2015.
Good luck and trade rationally.