
The end of the calendar year is in sight, the US FOMC has begun raising interest rates; the table is set for a transition into 2016 and quite possibly a different kind of market.
Charts Courtesy of Yahoo Finance.
The past year has been a wild ride. The strong bull market that has run the past few years has seemingly held up. However, it has not been able to advance much further. This year has seen many asset classes that previously boasted double digit returns fall back to earth with pretty underwhelming performances.
Is this a sign of a turn in markets or a pause? Time will eventually tell, however it should be quite apparent that this is not the same market dynamic of the past few years. The successful traders and investors have already been planning on this. It is in your best interest to do this as well and to start revisiting trading strategies and devising new ones.
One sign that we are fast approaching a new market regime is the long awaited US Fed decision to raise interest rates earlier this month. Despite raising rates a trivial amount of 25 basis points or 0.25%, the rate hike indicates a shift in thinking of the US Fed. The eventual normalization of short term borrowing rates will make asset managers consider alternatives to the equity markets as fixed income products become cheaper. This also depends on the “shape” of interest rate benchmark curves. For example, longer term bonds will need to become cheaper than shorter term bonds. This would result in a “steeper” yield curve, as short term yields would be below longer term yields. Then a logical argument can be made to borrow at short term rates to buy something that pays higher interest rates. This type of situation is just one strategy of many that can attract capital once the equity market does not appear to be the sure fire way to profits.
The story of economies, geopolitical situations, central banks will no longer be played out mostly in equity market indices. The lesser discussed stories of the past few years will begin to get noticed more. The strength of the US dollar, the Euro, US treasury rates, emerging market debts will soon be in the headlines more than the usual “all time high” or “correction coming soon” stories of the equity markets. Be prepared for change.
If we look back historically we can see the relationship between the US Fed Funds Rate and the S&P 500 index.
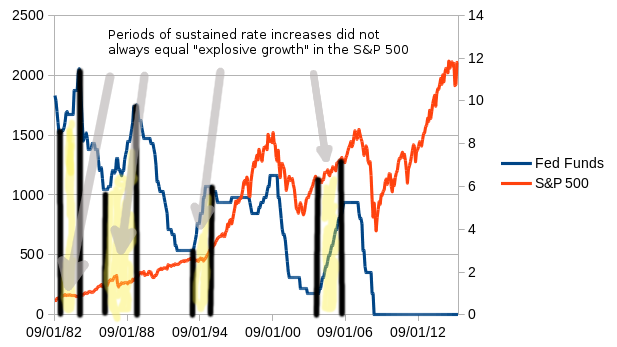
We can see that times highlighted in yellow when the US Fed Funds borrowing rates were being actively raised for prolonged times, the equity markets were relatively slow except for the period between late 1998 and 1999. It is quite possible that we won’t see the large gains we have become accustomed to. Do you really think buying the next dip will still work?
Another interesting tidbit of information can be gleaned from the following table:
| Periods of active decreasing of Fed Funds rates | Periods of stable Fed Funds rates | Periods of active increasing of Fed Funds rates | |
| Percentage of winning S&P 500 months AFTER rate hike | 63% | 63% | 59% |
This table represents three different types of US FED market rate activity. Periods when the FOMC were actively raising or decreasing rates and periods where rate changes were few and less systematic. What is being measured is the performance of the S&P 500 the month following the US FOMC rate decision. For example a winner can be declared if the Fed raises rates in January and the S&P 500 has a net gain for the month of February. This chart sheds light to the question of “what’s next after a single rate hike?” We see that monthly gains happen over 50% of the time no matter what. This just shows the upward bias the equity market has when looking at it since 1982. However, what is clear is that the probability of a having a net gain decreases from 63% to 59%. While this is not earth shattering, keep in mind that casinos have gone bankrupt when their odds of winning have decreased by less.
The week will include the New Years Day holiday on Friday so expect a muted week in terms of volume. Highlights include:
Monday – US Dallas Fed Manufacturing Business Index; Tuesday – US Consumer Confidence, US Case-Shiller Home Prices Index; Wednesday – Swiss Consumption Indicator, US Pending Home Sales; Thursday – European Central Bank Meeting Minutes, US US Weekly Jobless Claims, US Chicago Purchasing Managers Index.
The likely weekly ranges for popular ETFs are as follows:
| ETF Ranges for Week Ending January 1, 2016 | |||
| Ticker | Ticker Name | Lower Range | Upper Range |
| SPY | S&P 500 ETF | $201.10 | $208.40 |
| QQQ | NASDAQ-100 ETF | $109.80 | $114.70 |
| IWM | Russel 2000 ETF | $111.10 | $116.60 |
| TLT | 20+ Year US Treasury ETF | $119.70 | $124.60 |
| USO | US Oil ETF | $10.50 | $11.40 |
| GLD | Gold ETF | $100.00 | $104.80 |
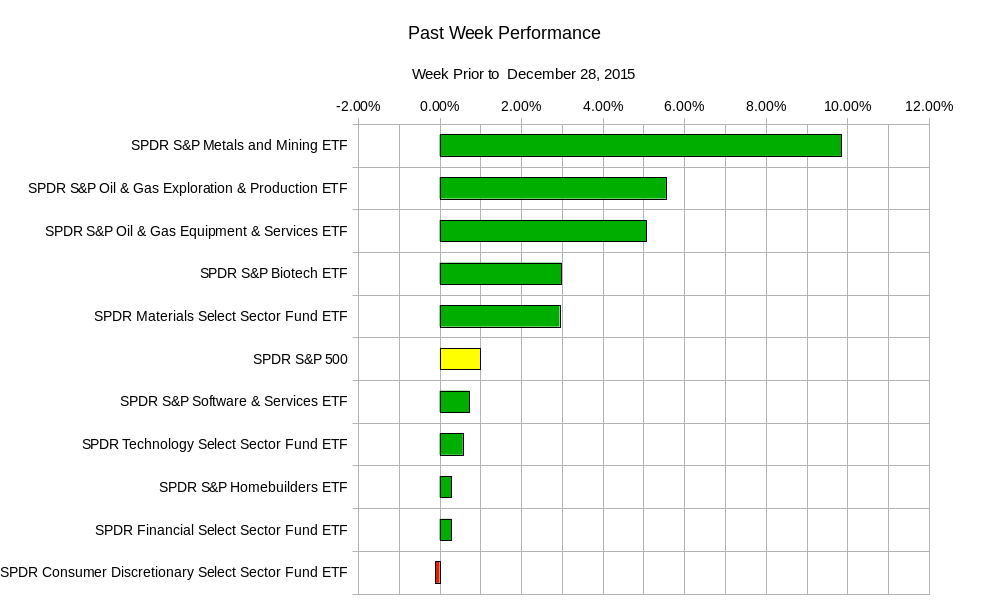
The popular notion of the “Santa Claus” rally was in full effect last week for most of the S&P 500 components.
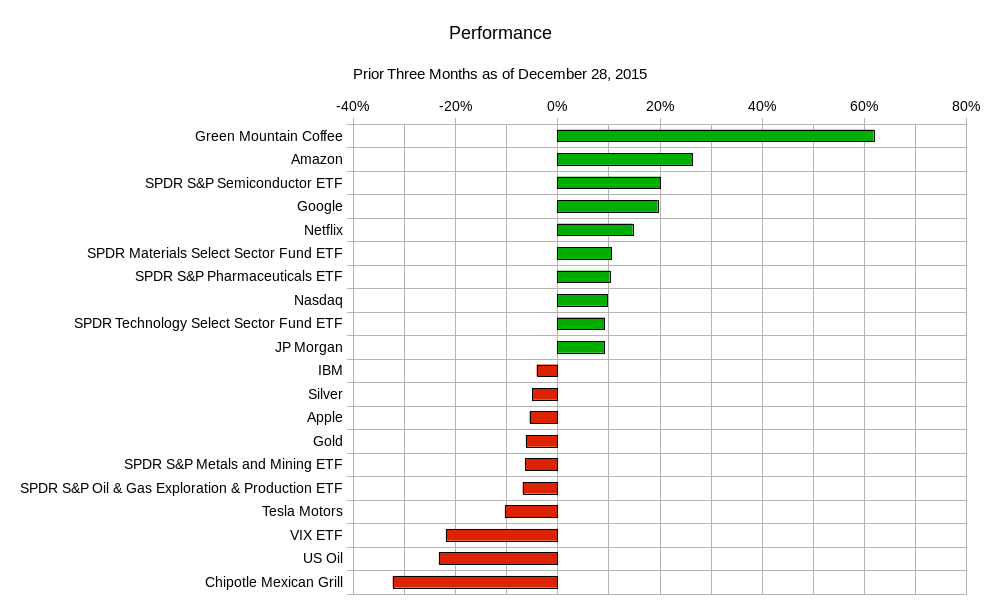
The past quarter results for a broader range of asset classes seem to reinforce gainers and losers for the year.
Markets are always dynamic and can change on a whim. When your money is at stake it is imperative you are ready to change with it. That means revisiting your studies, ideas, trading strategies, and your expectations.
Good luck and trade rationally.