
Now that most people have weathered the recent storm, the question is what is next?
Charts Courtesy of Yahoo Finance.
The Chinese markets are still a major source of concern for the market. Also looming in the background is what the next US monthly jobs report might bring to the discussion table for the US Fed concerning the looming rate hike. Another strong report may just make the fed rate hike almost a sure bet for September. A weak report will have people second guessing.
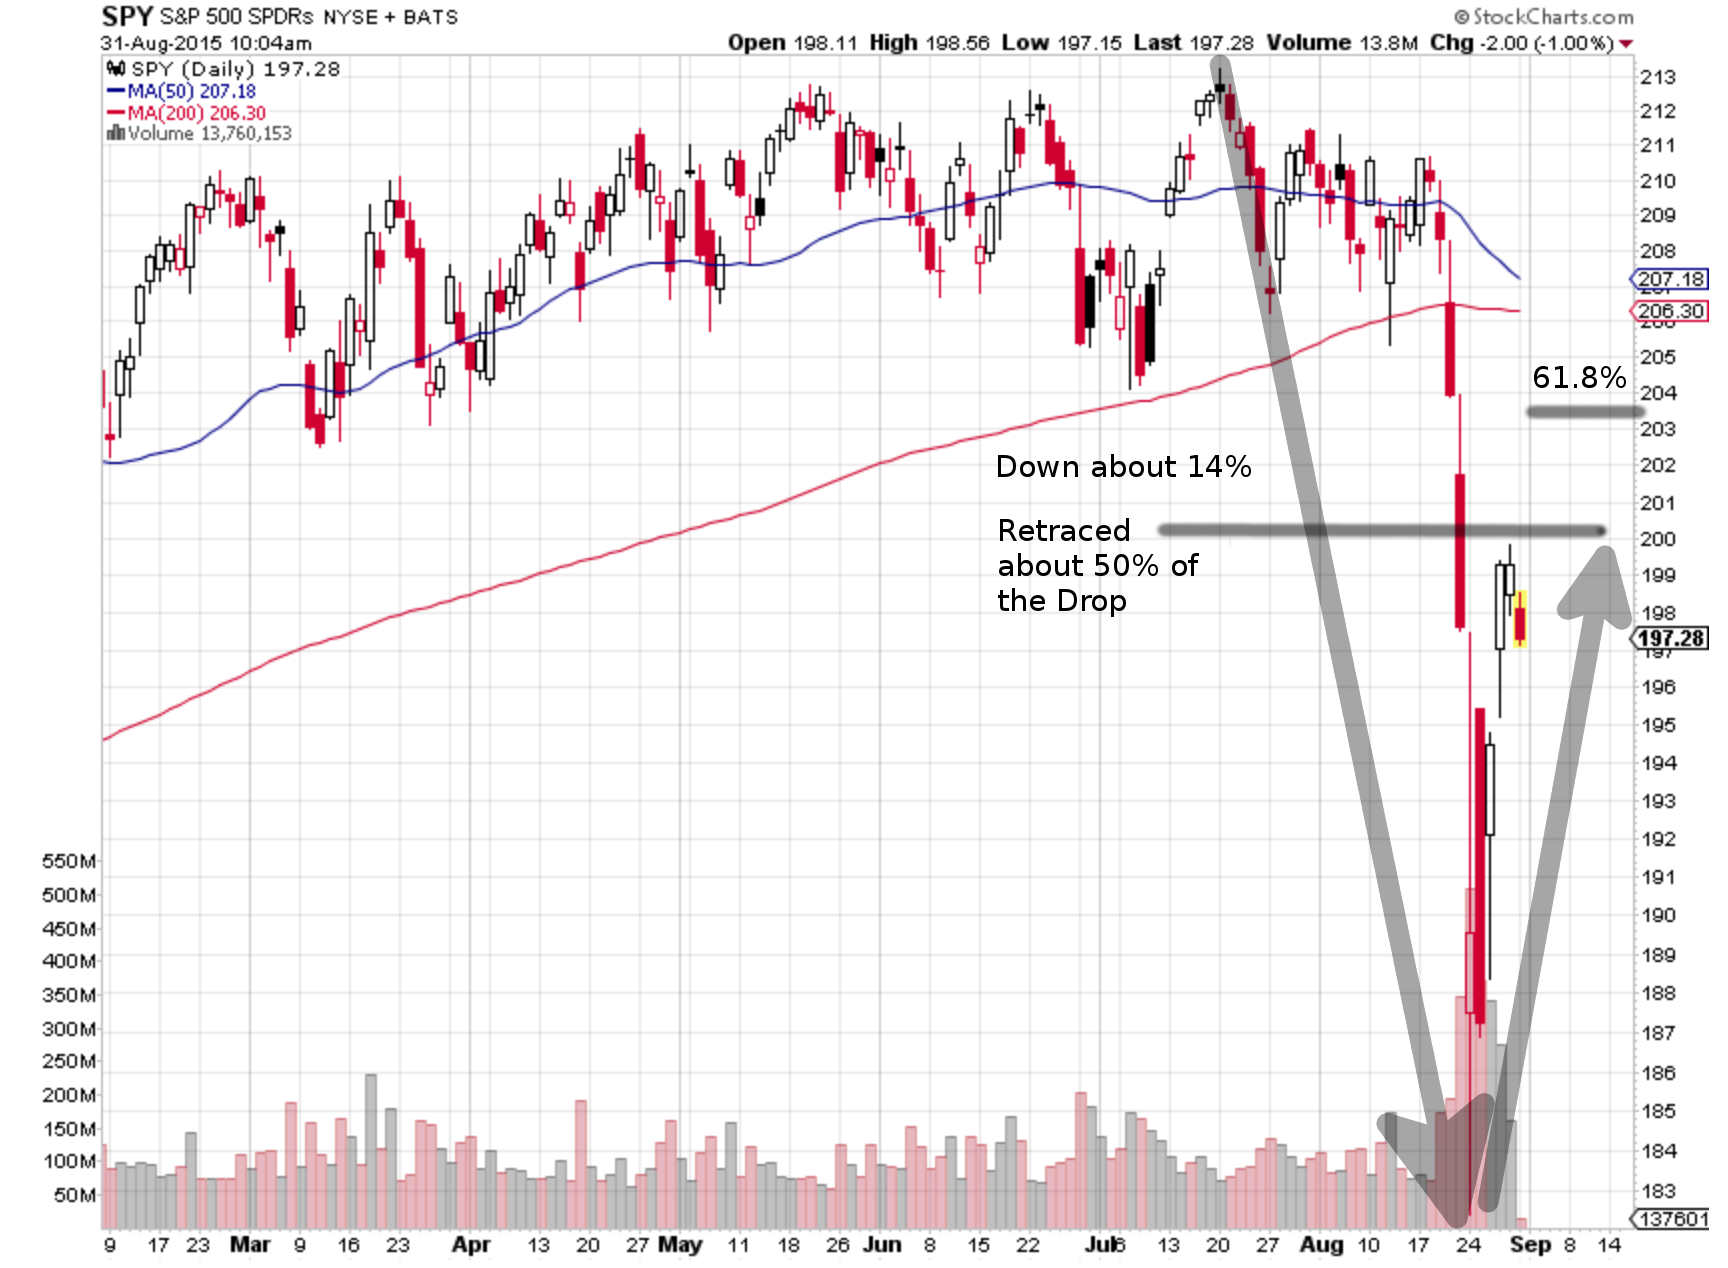
What is interesting is that the market sell off which saw around a 14% drop in the S&P 500 has retraced 50% of that loss, or only 7% below the most recent highs of the market. There are a number of market technicians who look at charts and their relation to Fibonacci retracements which are based on the golden ratio. In some of those circles, there is a mindset that once a sharp move is retraced 61.8%, then a counter trend is more likely to come into play. That means that in this case, once the S&P 500 is about 5.3% below the recent high then the gloom of a downdraft is less probable.
The becoming of the comeback is illustrated below:
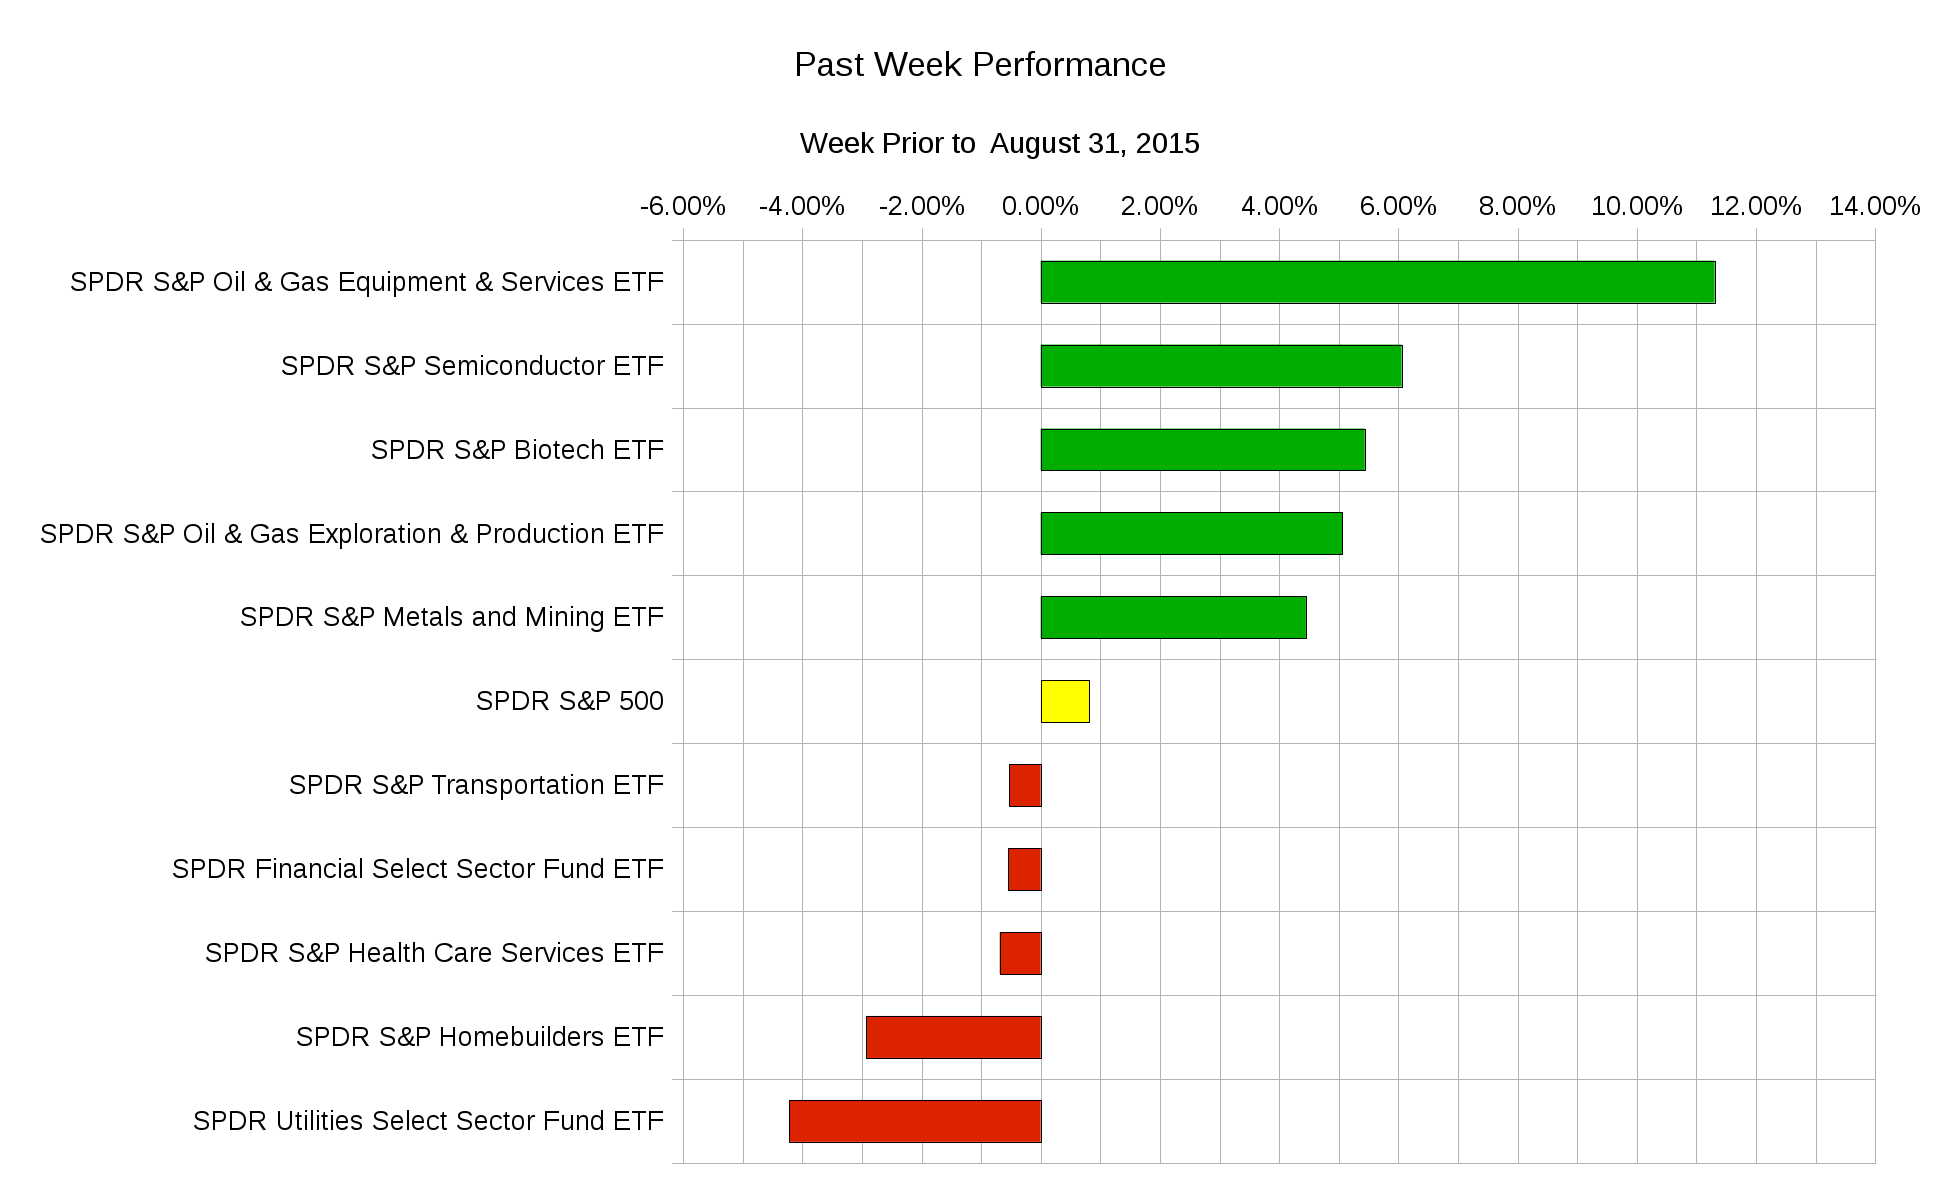
 Even if there is not much follow through in the bounce, it is interesting to see where the money went to. This represents where those who felt the market was cheap put their money. In the S&P 500 sectors, this looks like:
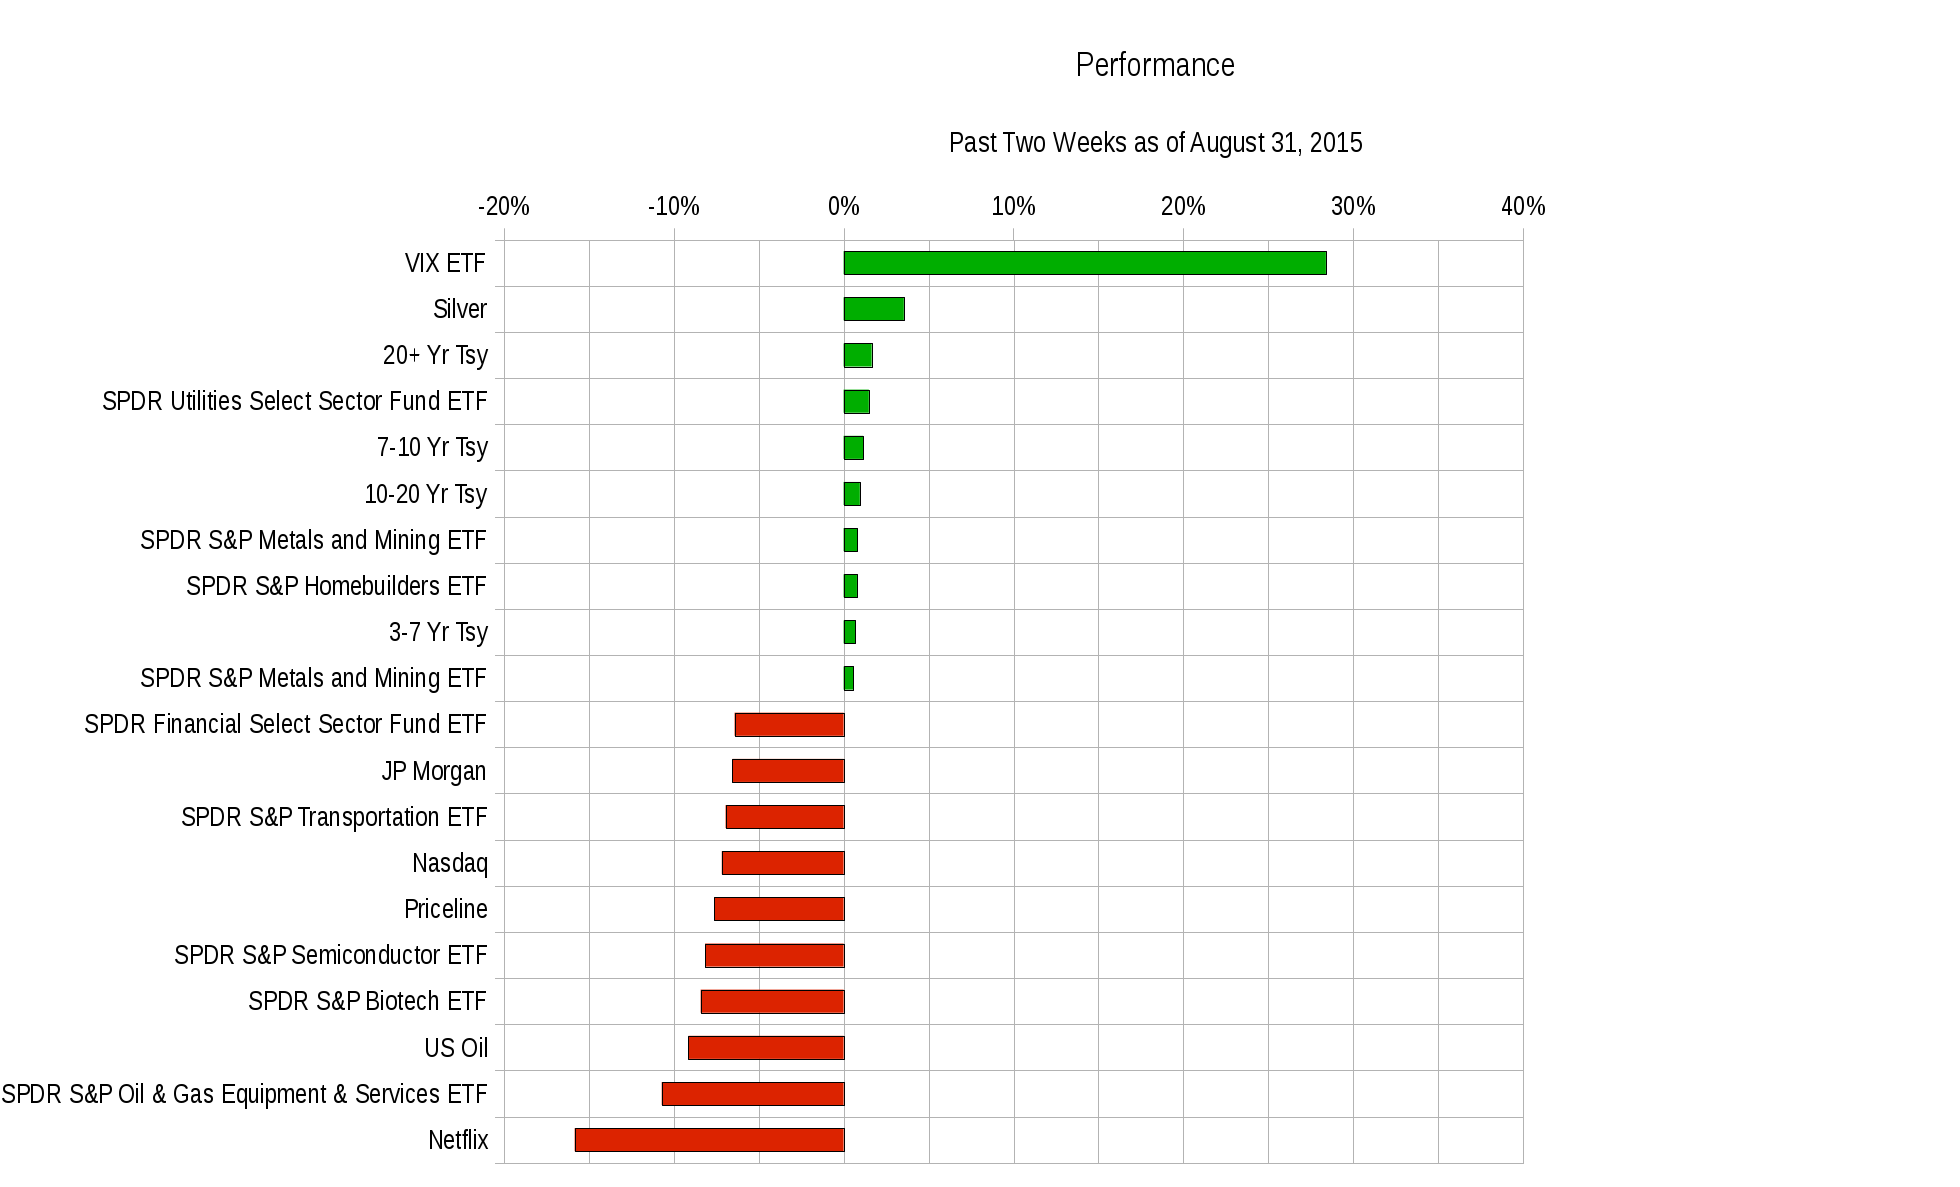
 In the bigger picture we see that US treasuries did extremely well during the recent volatility. This in the face of a changing US Fed policy towards interest rates.
 In the next week the economic data includes:
Monday – Euro-zone Consumer Price Index; Tuesday – China Purchasing Managers Index, Australian Central Bank Interest Rate Decision and statement, German Manufacturing Purchasing Managers Index, German Unemployment Report, Euro-zone Purchasing Managers Index, UK Purchasing Managers Index, Euro-zone Unemployment Report, Canadian Gross Domestic Product, Canadian Purchasing Managers Index, US Purchasing Managers Index, US Construction Spending; Wednesday – Producer Price Index, US Factory Orders; Thursday – Spain Purchasing Managers Index, European Central Bank Interest Rate Decision and Statement; Friday – G20 Meeting in Portugal, Swiss Consumer Price Index, Euro-zone Gross Domestic Product, US Monthly Employment Report, Canadian Monthly Employment Report.
The weekly ranges where some popular ETFs may end up are as follows:
| ETF Ranges for Week Ending September 4, 2015 | |||
| Ticker | Ticker Name | Lower Range | Upper Range |
| SPY | S&P 500 ETF | $194.30 | $201.40 |
| QQQ | NASDAQ-100 ETF | $102.90 | $107.40 |
| IWM | Russel 2000 ETF | $112.60 | $117.90 |
| TLT | 20+ Year US Treasury ETF | $120.50 | $125.60 |
| USO | US Oil ETF | $13.90 | $15.00 |
| GLD | Gold ETF | $105.40 | $111.00 |
Despite all the possible technical and qualitative reports, sometimes it is possible to make money following the herd. You just don’t want to be the last person out of an exit door. It doesn’t always pay to have a contrarian view. Following the path of least resistance for a short while may be worth considering. Keep track of where the money went when the market was “at a discount” recently. It will give you insight as to how those with extra capital view the market in the near future.
Good luck and trade rationally.