
With the wild roller coaster ride going on, its no surprise many traders are questioning the markets. The real questions should be directed inwards.
Charts Courtesy of Yahoo Finance.
Fears of a global slowdown have built up and a slowdown in China is being tabbed as one of the major reasons the market has been so turbulent. Many companies have spent a lot of capital tapping into the Chinese markets and if these bets go bust, there’s no telling what the repercussions might be. The effect of Chinese economic policy will also effect emerging markets who are trying to compete with China. Add to this the possibility of the US Fed raising rates at a moment of global weakness and you have a volatile mix of forces that will certainly move traders thinking in the near term.
This week the economic calendar includes:
Tuesday – US Home Prices Index, US PMI, US Consumer Confidence, US New Home Sales, New Zealand Trade Balance; Wednesday – Royal Bank of Australia Governor’s Speech, US Durable Goods Orders, Japan Foreign Investment in Local Bond and Equity Market; Thursday US Jackson Hole Symposium, UK Housing Prices, Swiss Industrial Production, US Core Personal Consumption Expenditures, US GDP, US Initial Weekly Jobless Claims, Japan National Consumer Price Index; Friday – US Jackson Hole Symposium, Swiss GDP, German Retail Sales, UK GDP, Euro-zone Consumer and Industrial sentiment.
The range for some popular ETFs this week will be:
| ETF Ranges for Week Ending August 28, 2015 | |||
| Ticker | Ticker Name | Lower Range | Upper Range |
| SPY | S&P 500 ETF | $194.40 | $201.40 |
| QQQ | NASDAQ-100 ETF | $100.40 | $104.70 |
| IWM | Russel 2000 ETF | $112.40 | $117.80 |
| TLT | 20+ Year US Treasury ETF | $124.10 | $129.30 |
| USO | US Oil ETF | $12.70 | $13.60 |
| GLD | Gold ETF | $108.40 | $114.10 |
There is certainly a lot of narrative concerning a slowdown in the Chinese economy. As an economic super power any weakness will have ripple effects on the global economy. This is a different narrative than the one that has presented itself in the recent past. The recovery of the US economy, firming of the European economy, and the Greek crisis. The Greek crisis seems less important to the market all of a sudden.
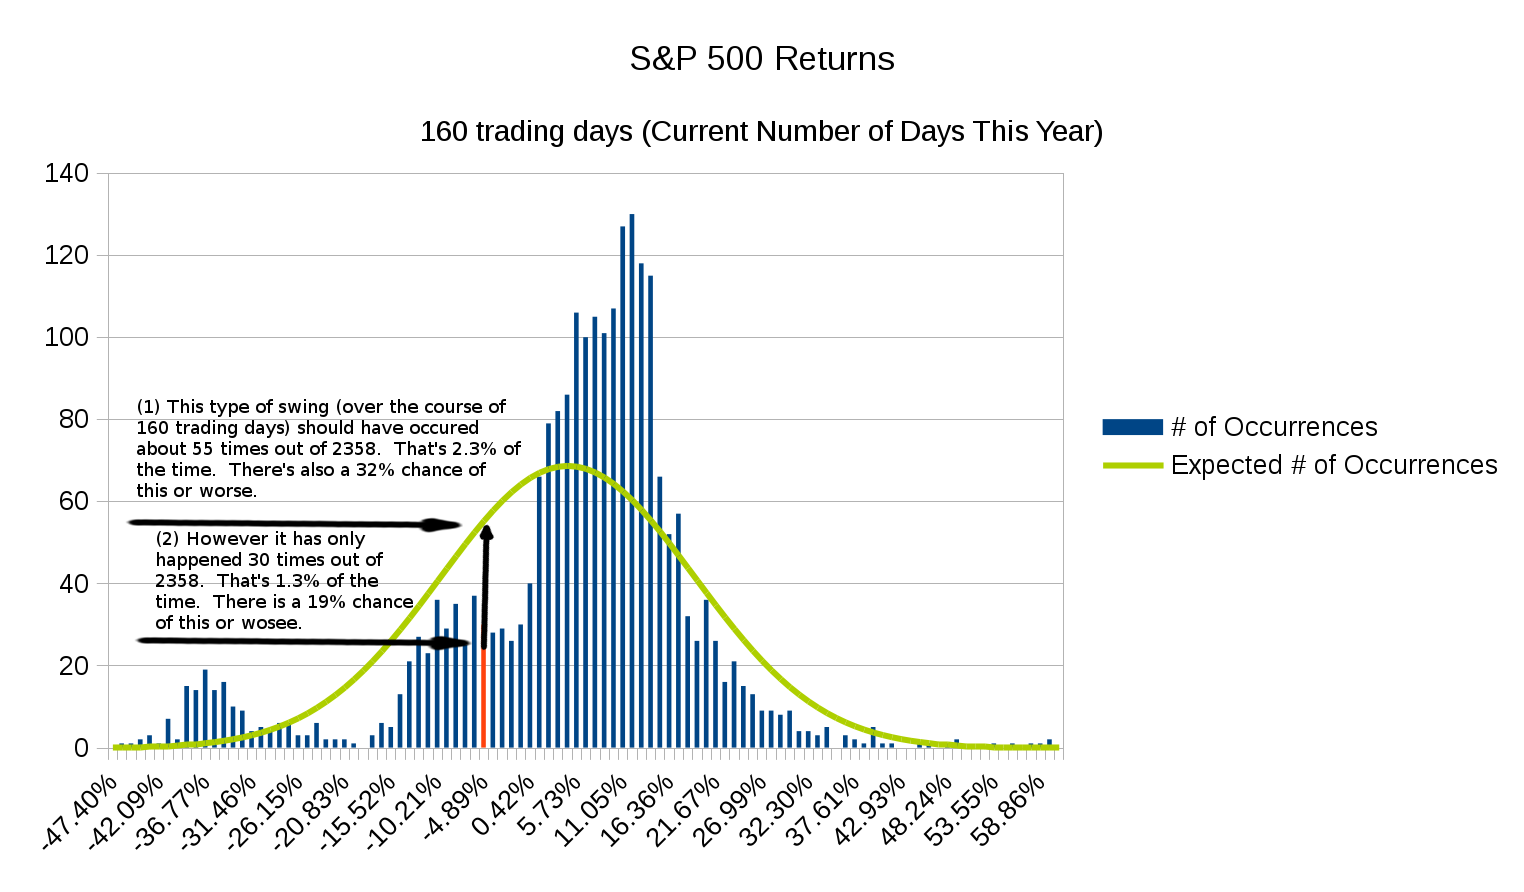
The market price swings seem daunting. When we look at different perspective we see that this kind of situation is not as crazy as it appears. Take the perspective of a long term investor. Imagine that you are looking at the year to date performance of the S&P 500. At this point there have been about 160 trading days out of a 252 day trading year. Look at any arbitrary window of 160 days; there are about 2,358 of these windows since 2005. The average price move is 4.7%. So of course you would expect to have a positive result right now if you were long the market.
However, remember that when you look at a historical set of data there is an average and a standard deviation to take into consideration. For this set of data from 2005 until now, that standard deviation is about 14.5%. Like it or not, many market participants think that market price changes behave in log-normal or normal distribution fashion. Even when this assumption fails, traders have been conditioned to have expectations that use the normal assumption.
Let’s follow that assumption for a moment. Even though the recent drop has felt like a fall off a cliff, in the year to date perspective it means that we are now at YTD performance of about -4.2%. Not exactly unbelievable. In fact, if you make the normal assumption, it means it should have occurred around 55 times out of the 2,358 data windows. It also means that this level or worse, for a year to date performance, has about a 32% chance of occurring.
In the reality of the data, this type of move has been seen about 30 times out of the 2,358 possible windows. That would leave you to believe that there is really a 19% chance of having that kind of year or worse so far.
 So the expectation of “winning” is higher because of what has been seen or remembered since 2005. Let’s not forget that markets have existed much longer than that. So despite the fact that the past week has felt like a roller coaster, in the grand scheme of things this type of behavior is not so rare if you look at the market from a larger time frame. Also, traders should be reminded that having a “losing” year so far actually has a higher probability of happening than recent memory suggests.
This larger time frame does not really heal the wounds of someone who has witnessed profit and loss swings of this magnitude this quickly. Which brings us to an important point of trading. Are you properly managing your risk? This does not only mean cutting losses before they become too large; it also means sizing your trades accordingly in the beginning. Perhaps 1,000 shares of Apple is too large a position for you. Maybe you should have started with 100. Maybe 20 call option contracts on Facebook seems reasonable, but when the value vanishes with a larger than normal move, are you comfortable with the loss? In this short period of time? It should make you examine your risk management and risk tolerance.
For the year so far, let’s see how some asset classes have performed.
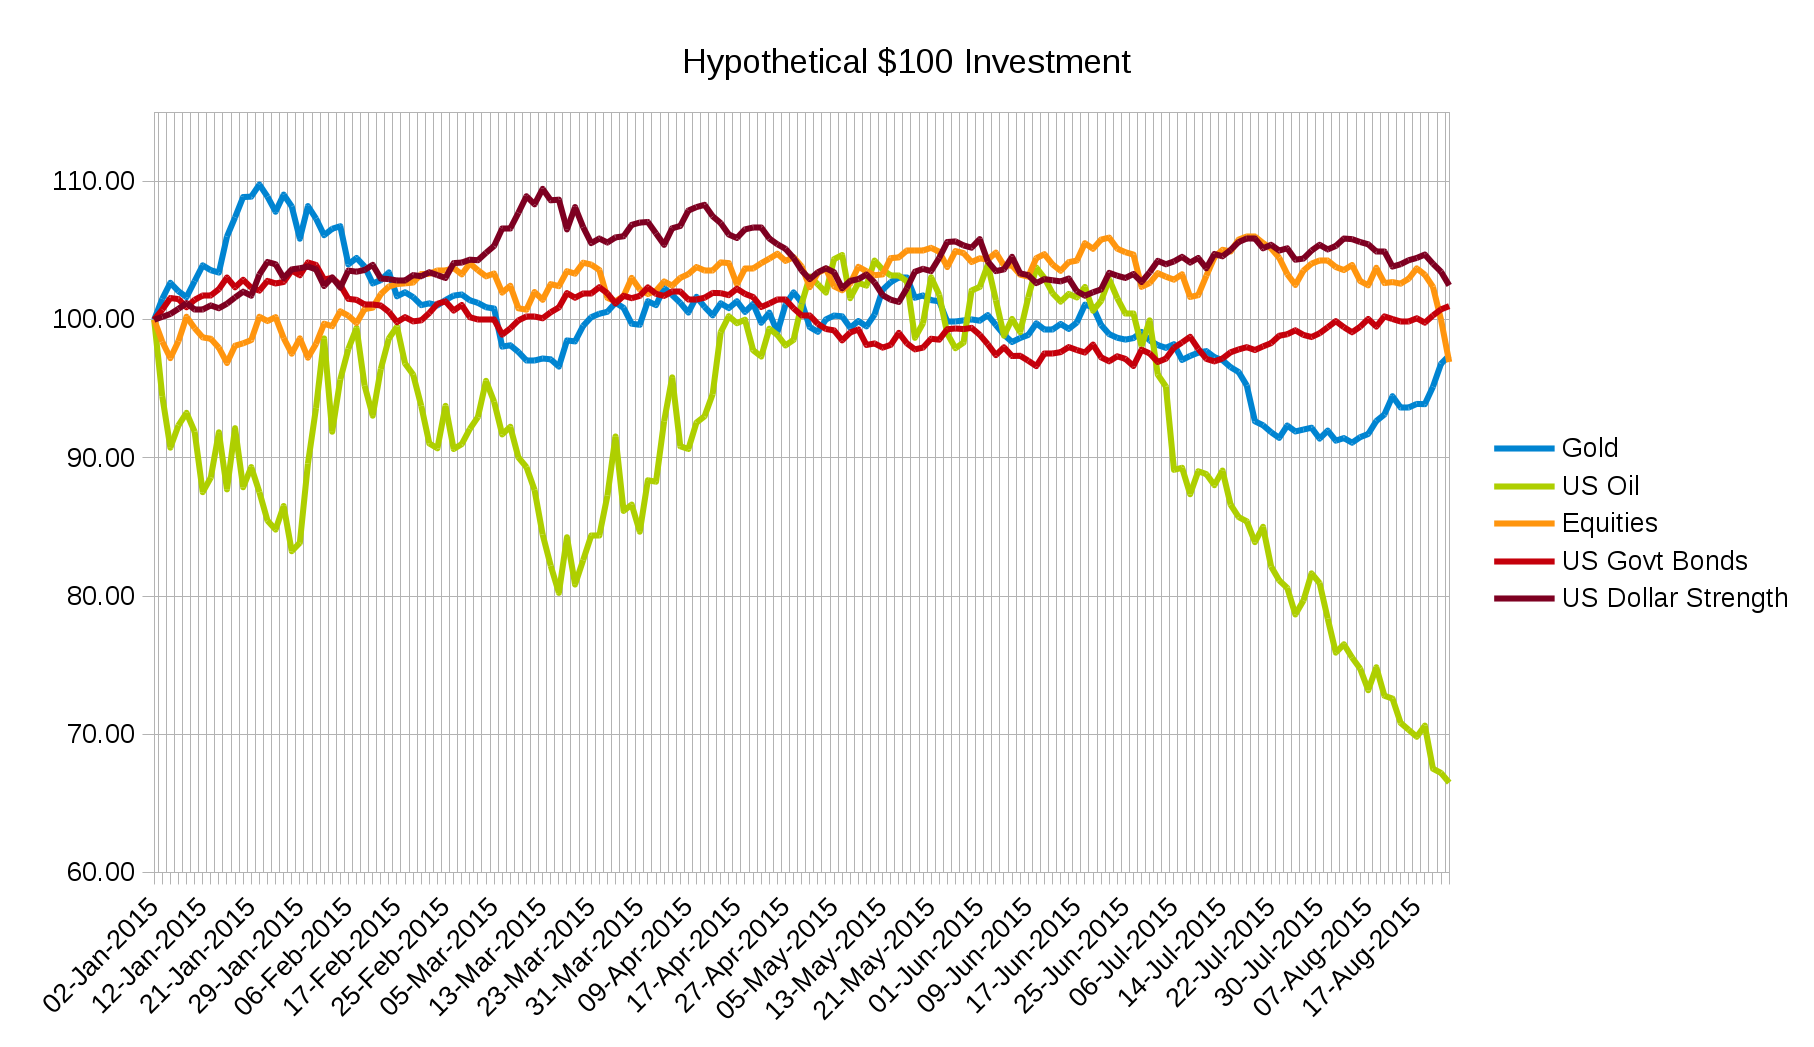 Except for oil, most asset classes are within reach of their starting prices of 2015. That doesn’t mean that there hasn’t been any outlying performances. Let’s recap the top winners and losers so far:
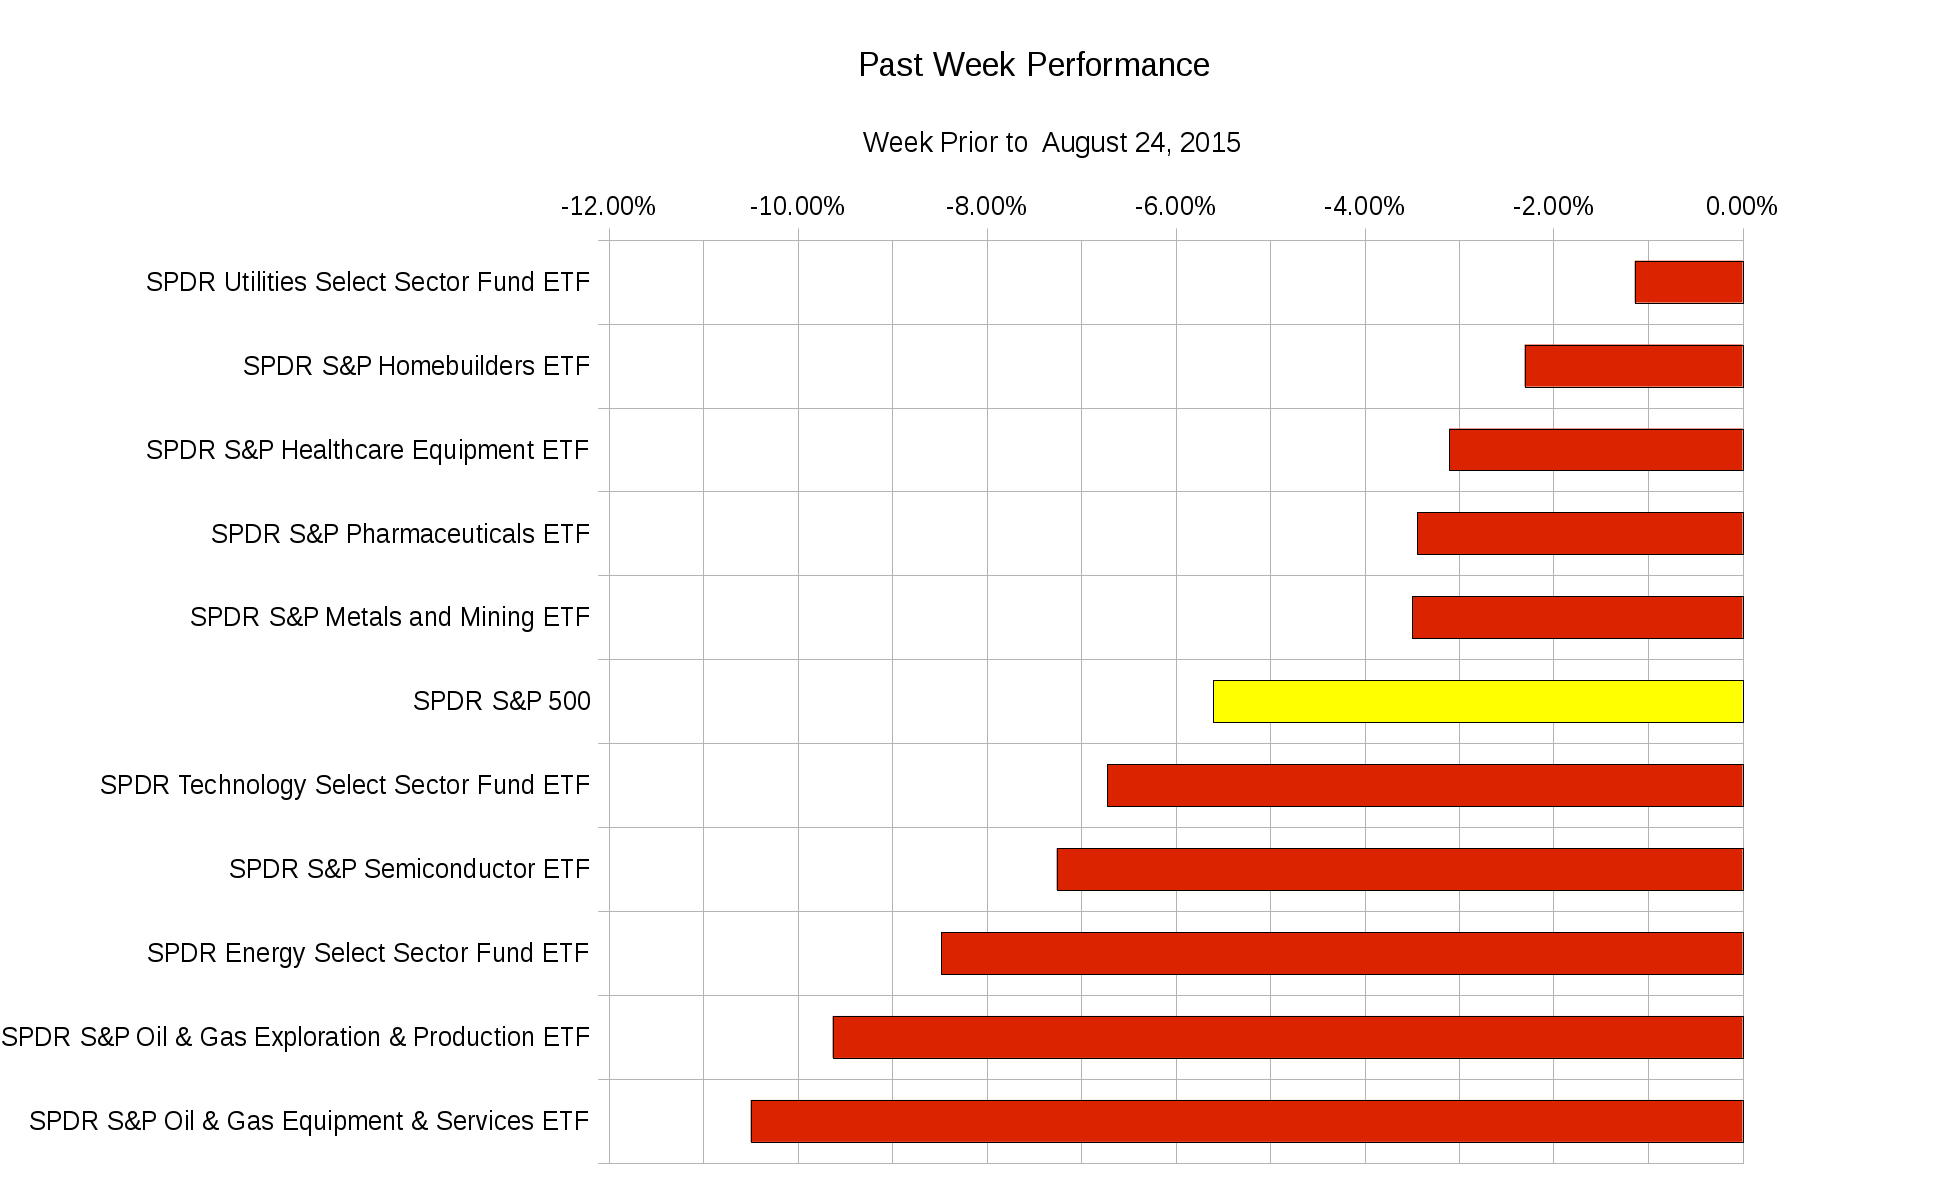
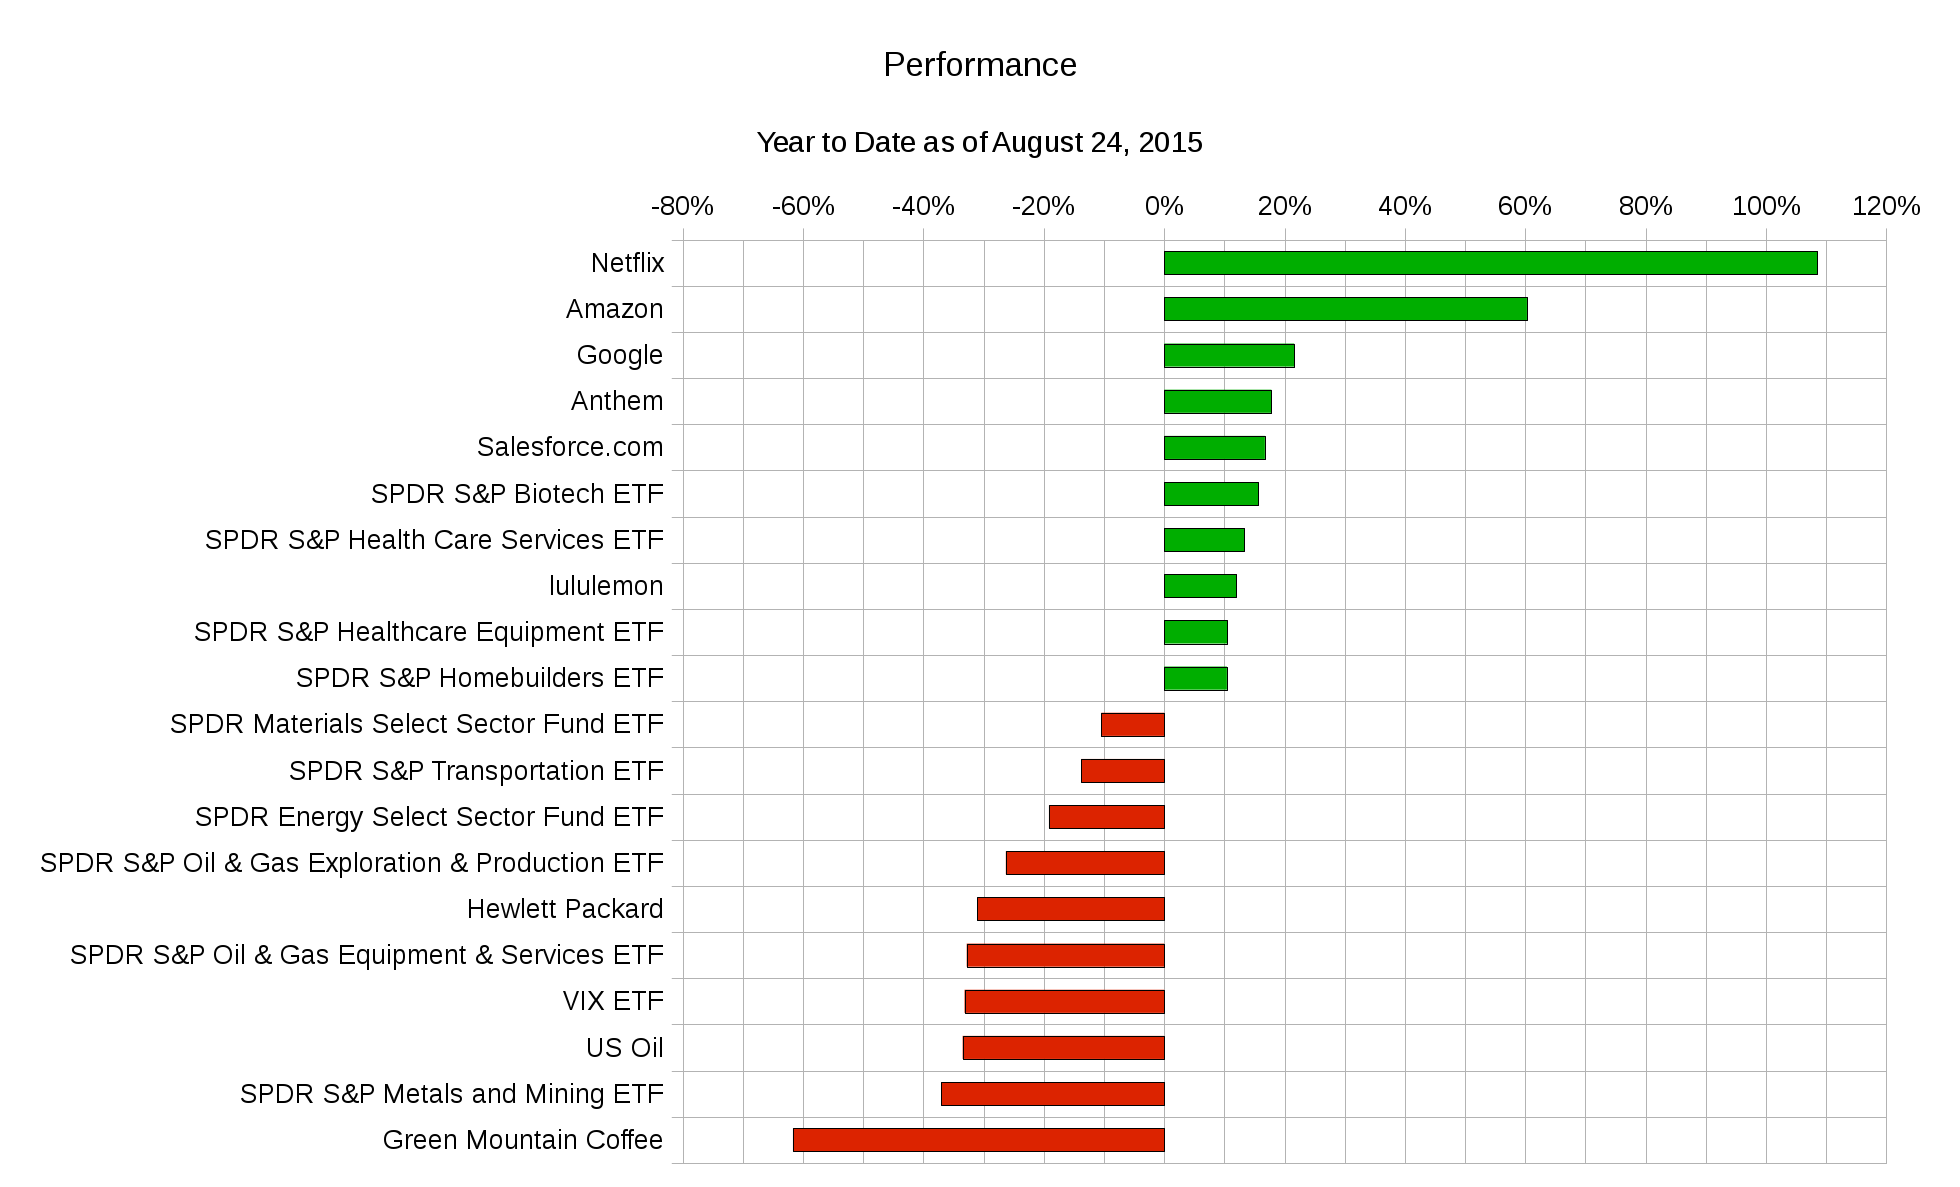 This past week has been brutal for all components of the S&P 500:
The lesson here is to make sure that your trading size is appropriate. No one should have to lose 160 days worth of trading on a single day. It may just mean you are expecting to make a year’s worth of profit in a week. Times like these make quick examples of traders trading too much money in a single strategy at once.
Good luck and trade rationally.