With the calendar year coming to an end soon, it is the perfect time to take notice of what has and has not happened in the market.
Charts Courtesy of Yahoo Finance.
It is hard to believe that despite all of the news and changes the world has gone through and all the changes your portfolio has probably gone through, that the year may well end up flat in most markets. Oil, however remains the outlier. If you had invested $100 USD in each of the most popular asset classes, buying and holding would have appeared to be very uneventful. Look at the chart below:
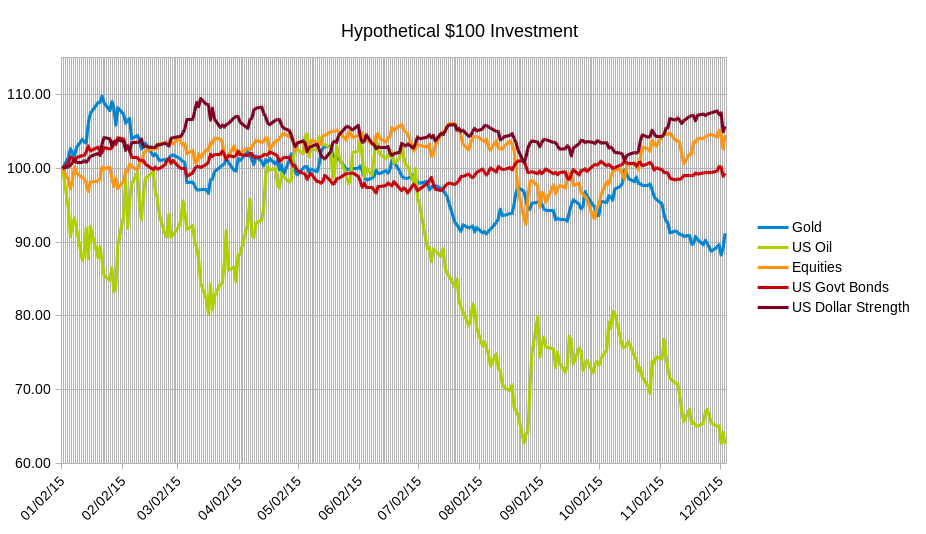 Besides oil becoming unhinged, most asset classes traded in tight ranges in the long term view. However, the graphic above does not tell of the roller coaster ride of news and events the market has taken this past year.
Despite the market appearing to close in on where it started in 2015, the shake-ups, mergers, central bank monetary policy, and geopolitical events led to a pretty wild ride in individual investments and market volatility over the course of 2015. This is evidenced by the disparity and lack of symmetry between the biggest gainers and losers in financial markets. This is highlighted by the graphic below.
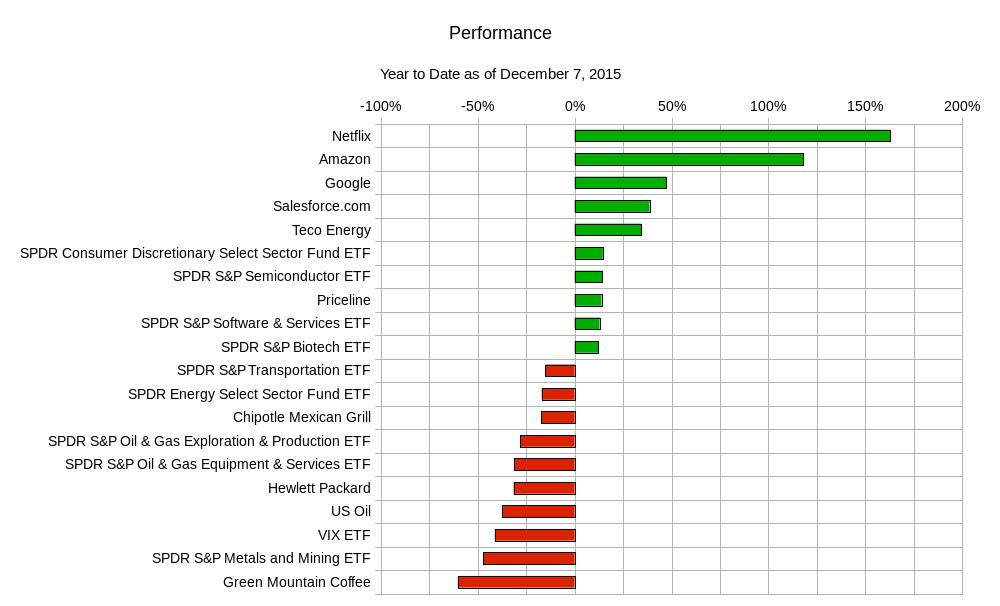 Overall there was pretty uniform weakness that is counterbalanced by just a few stand out performers like Netflix and Amazon.
This is seen at a different time frame as well by looking at just this past week.
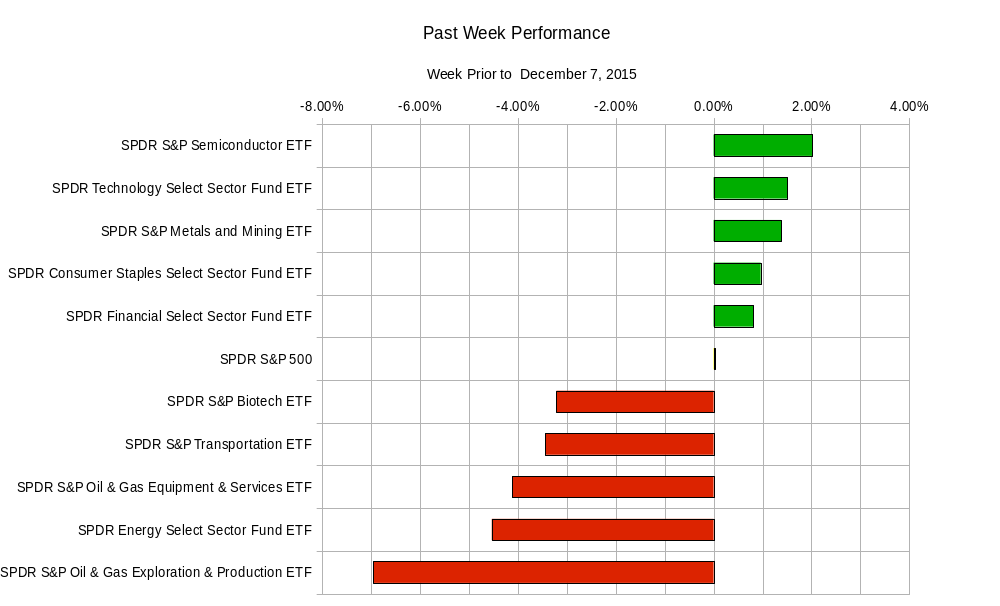 Money has been flowing out of some sectors and put into others, but they have tended to cancel each other out. As you can see above heavy selling in the oil and gas exploration and production sector was somewhat balanced by buying in the semiconductor space. The selling outweighed the buying, however the end result was a flat week overall for the S&P 500. Unbalanced market action such as the one just described may lead to the conclusion that cash is being tucked away for deployment at another time.
Though not entirely complete as an analysis, the above thought process is a likely description of what is going on. The end of the year is upon us and many money managers that have made money and want to collect fees on those profits will look to shut it down and be a bit more conservative. Others will try and eke out profits as managed money has had a tough go at beating indices lately. Those who fall in that camp will likely try to stir the pot and pick very specific asset classes or single stocks to make up for their underwhelming performance.
This week will feature a few global GDP releases with a number of global central bank rate decisions and monetary policy statements. Highlights include:
Monday – Bank of Japan Governor Speech, Bank of England Governor Speech, Japan GDP; Tuesday – Eurozone GDP, UK GDP Estimate, Canadian Housing Starts; Wednesday – Swiss Unemployment Report, Royal Bank of New Zealand Interest Rate Decision and Monetary Policy Statement; Thursday – Australian Employment Report, Swiss National Bank Interest Rate Decision, Bank of England Interest Rate Decision and Monetary Policy Statement, US Weekly Jobless Claims; Friday – Eurozone Long Term Refinancing Operations, US Retail Sales.
The weekly range of some of the more popular ETFs are:
| ETF Ranges for Week Ending December 11, 2015 |
| Ticker |
Ticker Name |
Lower Range |
Upper Range |
| SPY |
S&P 500 ETF |
$205.70 |
$213.20 |
| QQQ |
NASDAQ-100 ETF |
$112.60 |
$117.60 |
| IWM |
Russel 2000 ETF |
$115.10 |
$120.70 |
| TLT |
20+ Year US Treasury ETF |
$118.40 |
$123.10 |
| USO |
US Oil ETF |
$11.90 |
$12.90 |
| GLD |
Gold ETF |
$101.50 |
$106.50 |
This is an interesting time to determine whether or not you have over-traded the market only to be caught up in the churn or if you have been steady and are seeing only modest profits or losses. Whichever side you land on you should also be sure that your intentions and style matched the outcome. If you are the day trader type and have not profited much from intra-day volatility then its worth taking a second look at your strategies. If you are a buy and hold kind of person your returns should be at least close to or better than the generic indices. Otherwise you are getting caught up in choppy waters instead of taking advantage of constant tides.
Good luck and trade rationally