

Did the Friday Effect catch you long equities last week? If you didn’t read last week’s comments you can do so here. So far in 2014, Fridays have been bad for those long equity markets and this past Friday helped to continue that trend. Do not allow fear to creep in and cloud your judgment by making you think a huge crash is coming. Your energy is better spent on understanding how the market is evolving and what is the EASIEST way to trade around it.
Last week the S&P 500 was actually up for the week though that may not be the image that is instilled in your mind. The entire week up to Friday was relatively bullish with afternoon trading sessions typically building higher from the morning trading sessions. After the US employment report the S&P 500 made an all time high only to get slaughtered in the afternoon.
What to do now? Despite markets reaching all time highs in 2014, the market is structurally different these days. The structure consists of many things. Firstly, the type of companies that have been leading the market up has begun to shift. Secondly, the rejection of downdraft days (when markets rally strongly after large sell offs) has also changed from 2013 and prior. Let us examine these two aspects of the market.
First we have a chart of the performance of certain equity market benchmarks. We see that the darlings of the past few years that have given skyrocketing returns in recent history are starting to fall back down to earth. In their place, more banal categories that do not require much imagination in terms of their growth potential have seen money flow in. This week the performance was similar to last week’s which can be viewed in this post here.
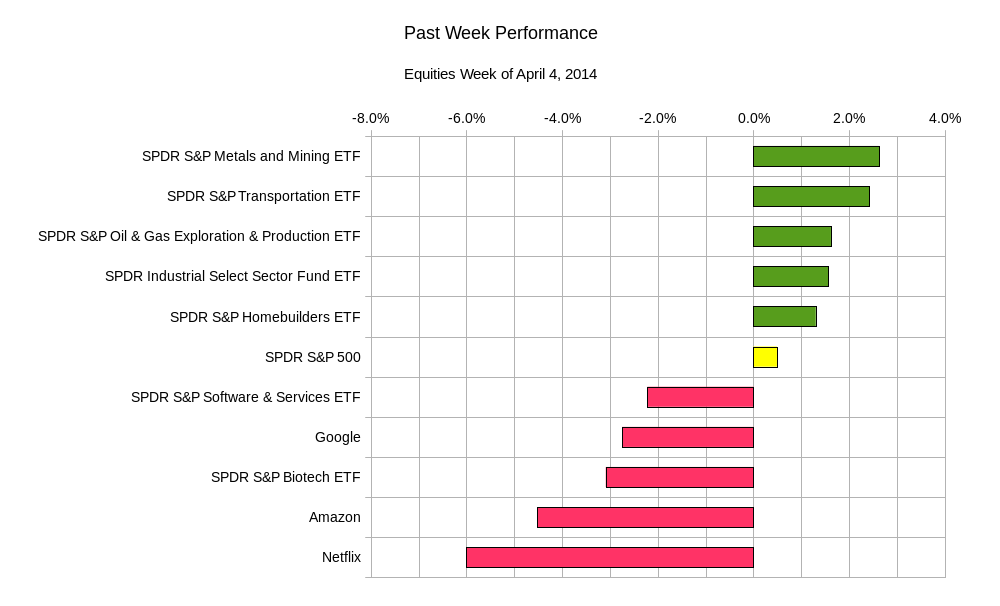
Typically when you see a sector rotation like this, where different sectors or specific names are being sold (or bought) contrary to their recent trends, we can tell investment sentient is changing. In this case, the highly volatile (though reliably bullish) sectors and popular stocks have seen investors literally run away and stuff money into the type of stocks that do not trade as strongly or swiftly. Think of the famous [amazon asin=0316183563&text=”Tortoise and the Hare”] fable. Amazon is playing the role of the hare while the S&P Transportation Sector is the tortoise.
The second aspect is best thought of as the rejection of downward drafts by the markets. To be more precise, think of when large downward price action has occurred in recent history. After the selling subsided the market has picked itself up and traded clearly above the trouble. We see this in the chart below. You will notice that the SPY ETF, which tracks the S&P500, occasionally breaks below a moving average trend line. When it recovers it usually forms a cushion and starts to trade a distance above that trend line. This cushion signifies trader’s rejection of the low prices, or rather they see the downward move as an anomaly and a buying opportunity. Traders continue to buy, causing the cushion described here.
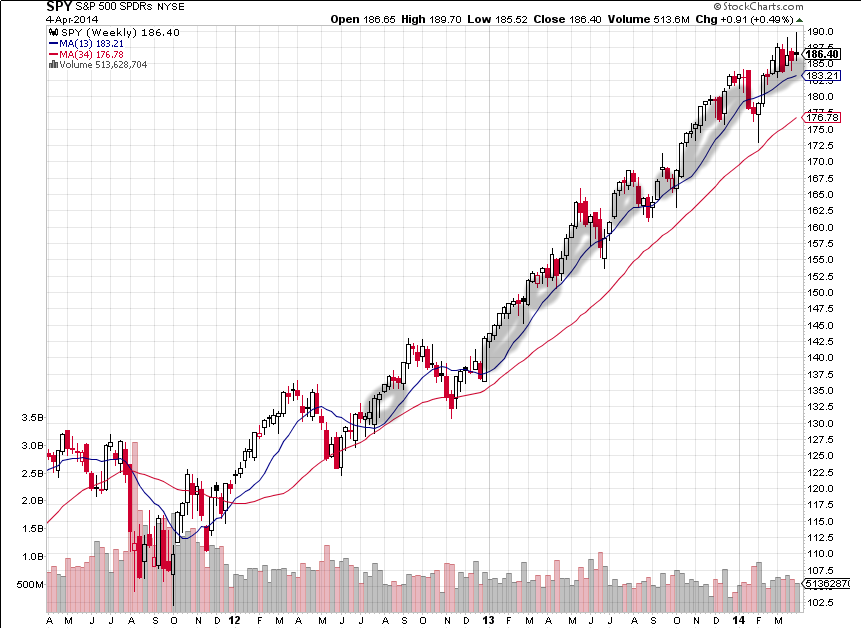 Chart Courtesy of StockCharts.com
While it may not seem obvious from the drawing above, the cushion, or grey areas have been much more pronounced during 2012 and 2013. This last break, where the S&P 500 dipped below the moving average and is now peeking above it is somewhat different. The ETF has not cleared the air or rather put significant distance above the moving average line. In prior breakouts, highlighted in grey, the SPY trading range for the majority of the candlestick is clearly above the moving average. This is not the case here.
What does this mean going forward? This does not have to signal the end of the most recent bull market. The fact that the market does not seem as virile as it has in 2013 does not mean that it cannot again make a new high. However, a note of caution should already be in your trading psyche. Since the SPY has not been able to form a large cushion and investor sentiment has rotated into more conservative and less volatile sectors, it may mean that it is easier for the market to sell off than it is to make fresh highs and stay higher. For the equity market to return to its momentum bull trend, the sectors and names that were recently shunned will have to come to power again. Until then, buyer beware.
What looks to be on the horizon is an eventual convergence of the red (longer term) and blue (shorter term) moving average lines from the chart below. Perhaps the lines do not meet for some time, but when they do it will probably be due to a strong downward move in the market starting a downward trend. The last time these lines have met, a market correction of around 16% was witnessed. With the somewhat range bound action as of late, the meeting of these lines may not require a sell off of this magnitude. If things evolve in a somewhat consistent manner a 5-10% sell off in three to four months could help bring the two lines together. That alone would not signify the end of a bull market.
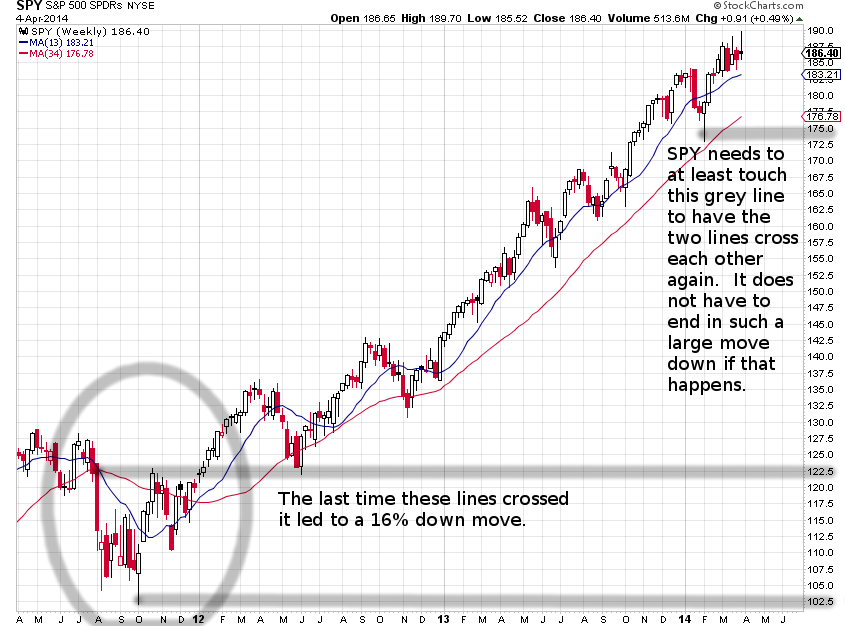 Chart Courtesy of StockCharts.com
At the higher levels perhaps the market counteracts quickly. It may only signify that traders still believe in the bull market, but they want to buy at 5-10% discount. It will be easier to fall into a lull and not recognize the situation that is forming. The trading range has kept prices in check so that it makes it easier for these lines to meet.
Furthermore, earnings season is set to begin this week. This may result in muted market movements on the upside since companies have set the expectations so low. Companies meeting or exceeding expected earnings results may mean large upticks in their own equity, however the reaction will be hard pressed to carry over into the broader market indices. Disappointing results may bleed into the broader markets in contrast. Everyone already knows expectations are low, so an earnings miss may trigger a lack of confidence vote in the broader markets.
This week in terms of economic data highlights will include: The Bank of Japan Interest Rate and Policy Decision and Statement, Alcoa earnings on Tuesday; US Federal Open Market Committee Minutes on Wednesday; US Weekly Jobless benefits claims on Thursday; US Producer Price Index, JP Morgan earnings, and Wells Fargo earnings on Friday.
The SPY ETF looks set to land between USD$182.30 and USD$189.80 this week.
Patience and tight controls will be required to navigate the choppy waters of this market now. The market does not seem to feel the need to rush into any position nor should you.
Good luck and trade rationally.