
Is this the volatility you have been looking for?
Be careful what you ask for because you might just get it. In any event, the beginning of the month has shown some swift declines that has caused those investors with their heads stuck in the sand to perk up. Now the hard part; is it a buying opportunity, a short signal, or perhaps nothing more than an opportunity to sell options to collect premium on a spike in volatility?
If you are looking for economic data to lead the way, then the rest of the week does not have much to offer save for some key European rate policy decisions on Thursday. Then some Asia-Pacific rate policies on Friday.
Wednesday – German Factory Orders; Thursday – Australian Employment Report, UK BoE Interest Rate Decision and Asset Purchase Facility Update, European Central Bank Monetary policy statement, US Initial Jobless Claims; Friday – Australian Monetary policy statement, Bank of Japan Monetary policy statement, and Canadian Unemployment.
The recent slide is broad based leading to believe that this is a legitimate spook, or a re-calibration in the markets. The past week sector rotation has shown that no sector was really safe.
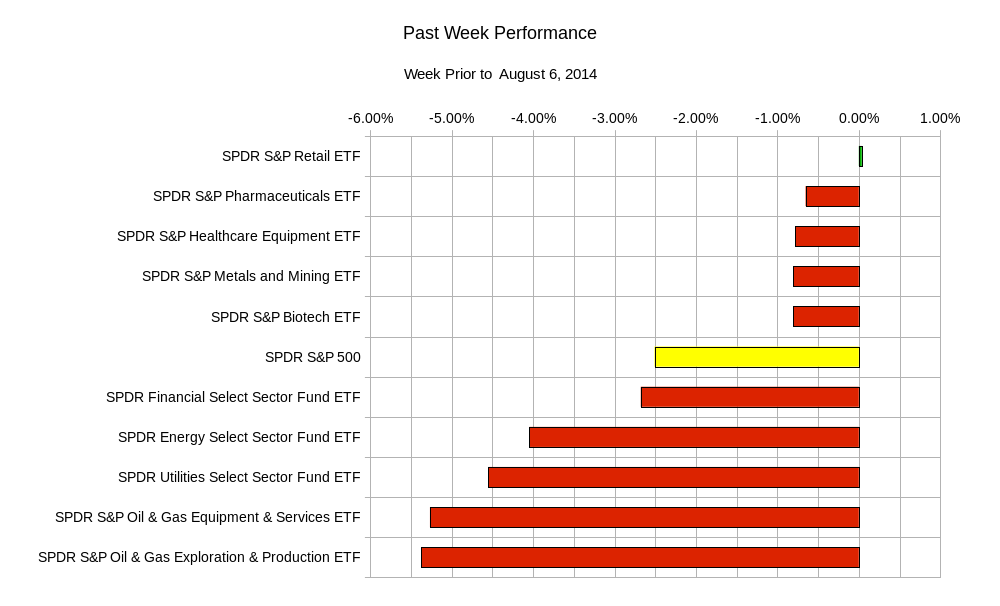 Usually if there was still a defensive stand in the market some sectors such as Utilities, consumer staples, or defense and aerospace stocks show positive or at least less negative results. Partially to blame for this recent rejection of equities might be the US Federal Open Market Committee (FOMC) policy statement which has hinted that current US labor and inflation conditions have shown improvement. The focus previously paid to the jobless rate has shifted to a number of other employment indicators. This points to a less quantitative approach to rate policy. Which in reality may mean a less predictable approach. The markets do not take to kindly to uncertainty and less predictability. Rate hikes by the US FOMC are an eventuality if the US economy stays on track. The market may just wait and see if things are done in an orderly process. To put it in perspective the last increase to the Federal Funds Rate was in June of 2006.
For the remainder of the week the SPY, the S&P 500 ETF, may land between 188.40 and 193.70; GLD, the gold ETF, may end between 121.60 and 126.30; USO, the oil ETF, looks poised to land between 35.60 and 37.30; TLT, the 20 year and out US Treasury ETF, might end between 113.60 and 117.10.
In terms of a short term view, the S&P 500 index has consistently risen to new all time highs as of late. This has also made support levels somewhat lower than usual. At least they feel as if they were far below because the lack of volatility shows few examples of prices dropping and being brought right back up. In other words there is less of a cycle. This recent drop has only resulted in a 3.6% decrease in the SPX, S&P 500 index.
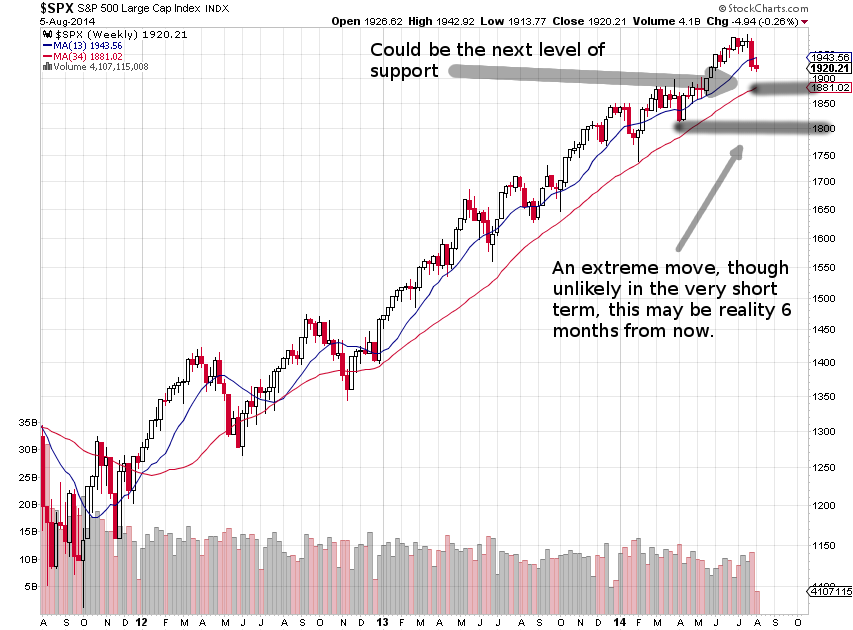 Chart Courtesy of StockCharts.com
As evidenced by the chart above there is still room to the downside. A 10% correction from the high would be below the 1800 level that seems extreme in the very near term (perhaps until the end of the summer). However there is enough precedence and statistics to show that it is not impossible, it would just break current momentum. Will the catalyst be an unpredictable change in US interest rate policy? Geopolitical tensions have been brushed off as of late so only time and prices will tell.
Good luck and trade rationally.