

After a week of choppy trading it feels like the summer market doldrums is happening now. S&P 500 futures traded at about half of the usual trading volatility. The market has been more accommodating for those that can pick stocks at the right moments. Make sure that your broker is not making more money from commissions than you are making at trading. Could Monday’s Equity party finally break the market out of its trading range?
Last week the theme of sideways market index trading along with specific sector rotation has continued. In particular, small cap names, were sold off in favor of more traditional blue chip names. 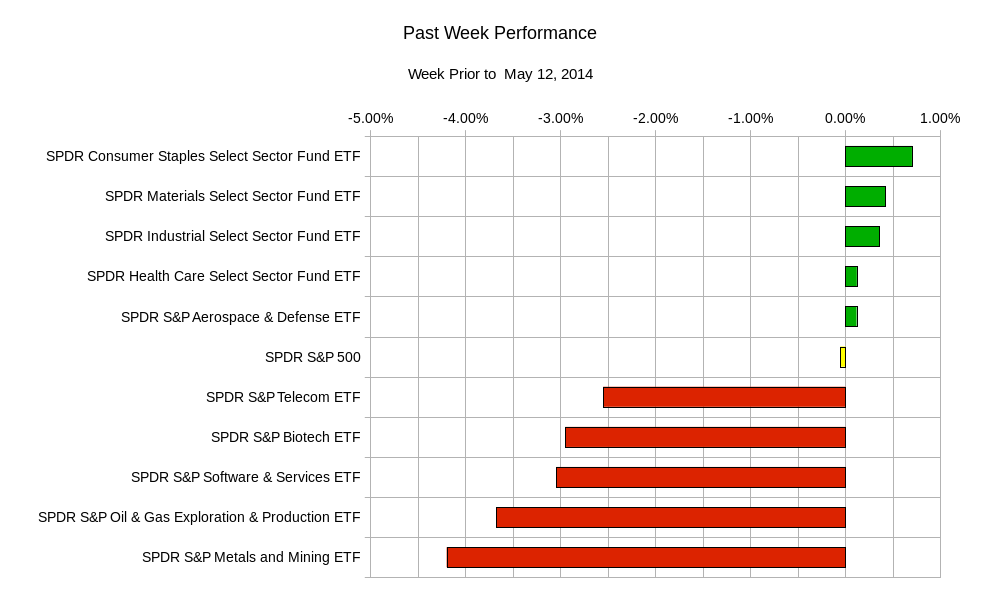 Last Monday saw some initial buying in the morning as investors started testing the waters after receiving news of a tepid manufacturing report from from China, and a European Commission warning on inflation. Tuesday saw a reverse of the Monday trading session. Wednesday saw an initial dip and recovery on the heels of news that Russia has made efforts to reduce tensions in Ukraine. Thursday saw some buying and then started to sell off that continued after a lackluster US long term treasury auction. Friday saw a buck in the trend of sell off Fridays.
If you are looking for economic news to move the markets this week then you might be disappointed:
Tuesday – Australian Budget Release, and US Retail Sales; Wednesday – UK Unemployment Rate, UK Bank of England Quarterly Inflation Report, Japan Gross Domestic Product, and US Producer Price Index; Thursday – Euro-zone Consumer Price Index, Euro-zone Gross Domestic Product, US Philadelphia Fed Survey, US Weekly Jobless Claims, and US Consumer Price Index; Friday – US Housing Starts.
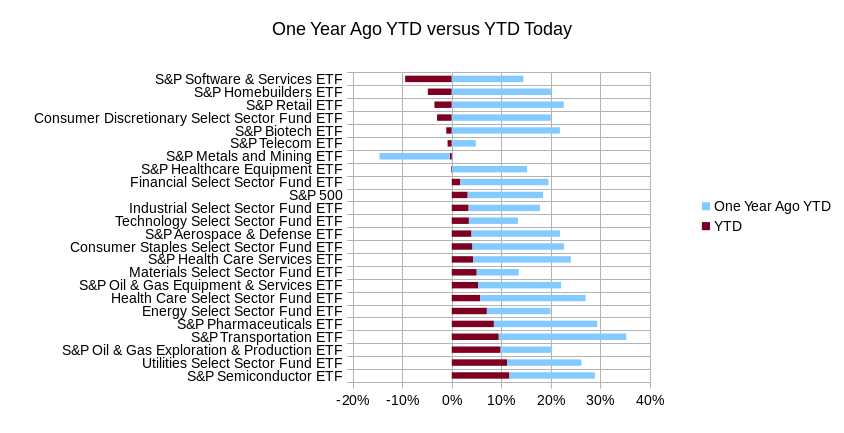
This week brings another test of all time highs in equities. Monday saw major indices rise into record high territory yet again. It would seem that the slow and steady investor in the broad indices is having the easier time this year. Unless you have been able to profit from the sector rotation, you might be a victim of the churn of the market as of late. This is in contrast to last year where every sector had gains except for Metals and Mining. It was much easier to be a successful bull market trader last year than it is now. Adjust your trading style or recognize the shift in the market and stay away until you have the advantage again.
Where does that leave us now? In the big picture it is not clear that there is a break in the upward trend of the market. The past few weeks have formed a bit of a plateau. If we look at prior plateaus in recent history we see that they are mostly followed by a dip and then on to new all time highs. The caveat here is that in order for you to be profitable you need to have invested money in a prior plateau and dip cycle or be patient. This bullish trend has only rewarded those with patience and large risk appetites. It has been easy to get caught in the trappings of every voice in financial media calling a top and subsequent “correction”. At some point those voices will be right. A broken clock tells the correct time twice a day. Below we see some plateaus highlighted in grey. In a number of these cases, it would take weeks and months to be able to profit if you bought at around a level of a plateau.
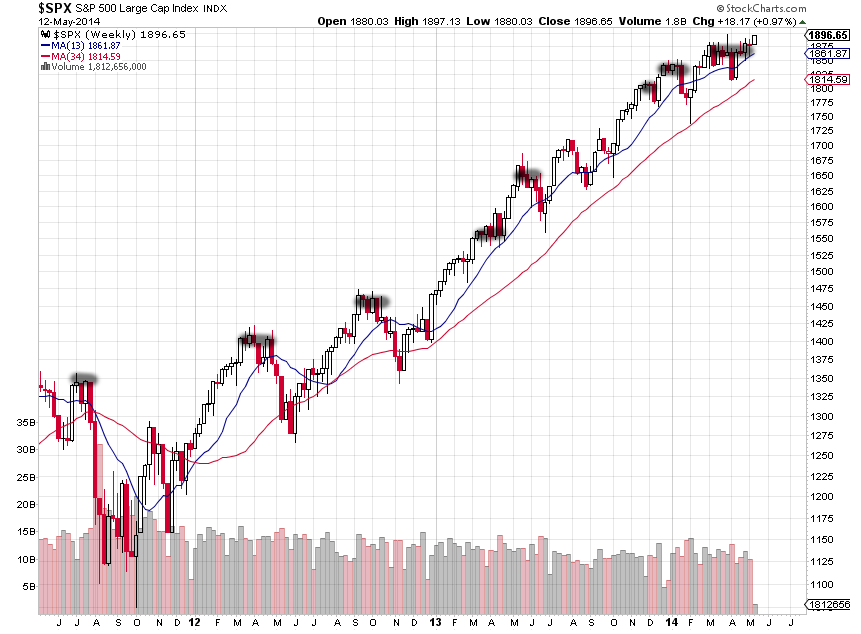 Chart Courtesy of StockCharts.com
Either be very patient with your trades if that is acceptable to your risk/reward tolerance, or take smaller gains quickly to reduce your time exposure to the markets.
In terms of smaller time frames, we can look at the range bound choppy trading we have been in for most of the year. Split the range of trading outlined by the grey highlighted bars by three. You then have the inner golden bars dividing the entire range in three.
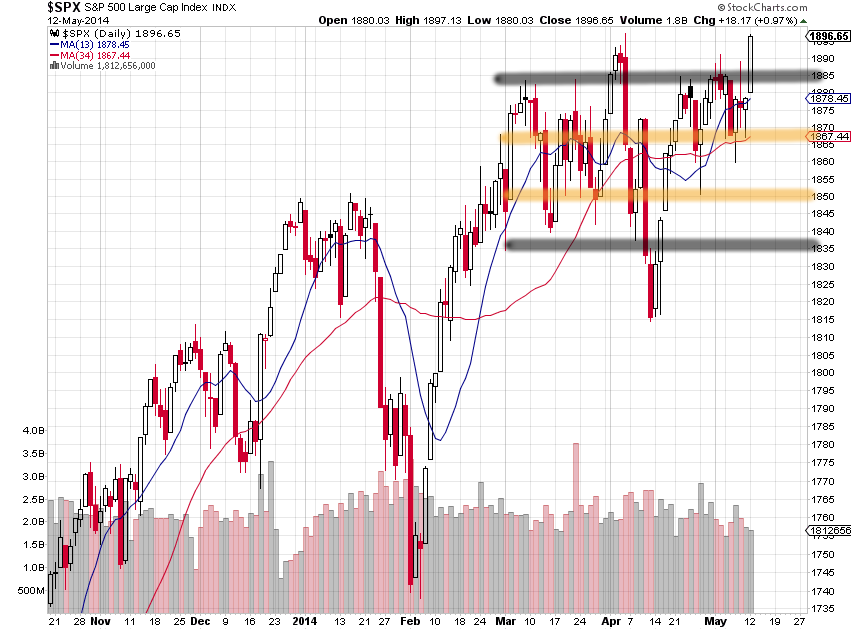 Chart Courtesy of StockCharts.com
If the bulk of prices has remained in one of the thirds then it has been relatively safe to trade either to the long or short side. In these cases, there has been enough choppiness in the market to quickly scalp gains in either direction. These times have been highlighted in green in the same chart below. 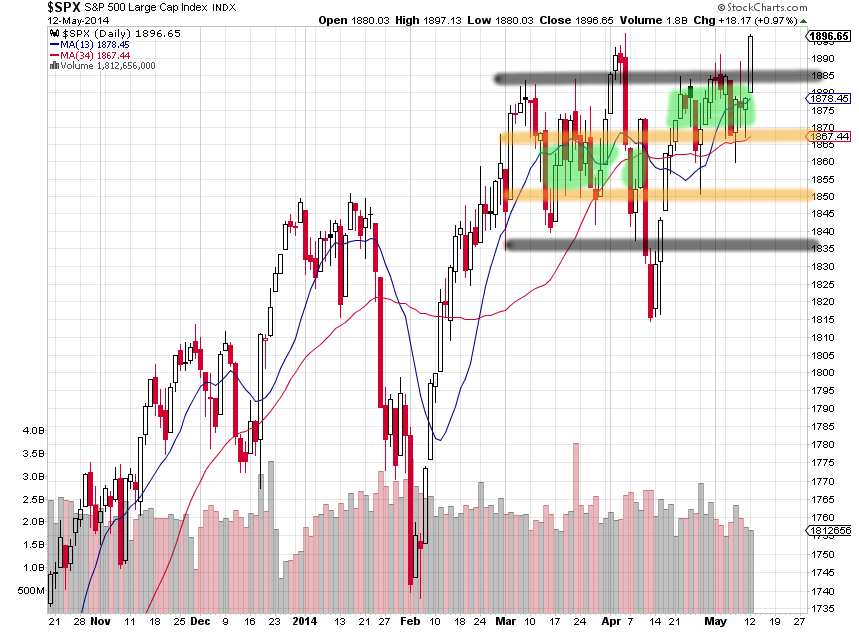 Chart Courtesy of StockCharts.com
However, when outside of one of the heavily traded clusters, it has been susceptible to very short term trends which might hurt those traders who try to be nimble enough to get in and out. In the environment we are in today, where we are outside of the range, it might be prudent to count less on the tendency of prices to cluster in case there is a trend beginning to form. Short speculators may be in for some short term pain.
Perhaps things quiet down and we are back in the trading range as well. If that is the case, it might be safer to wait until prices start to cluster together again. Then the scalp traders may have more buffers in which to profit.
In this week we can probably expect to see the SPY, S&P 500 ETF, land somewhere between $186.80 and $193.60.
It does not matter how strong or weak you believe your investment thesis is. Always think that the market environment in which you formed your plan in may no longer exist. Do your ideas need adjusting? Are they still valid? Complacency always guarantees losses.
Good luck and trade rationally.